
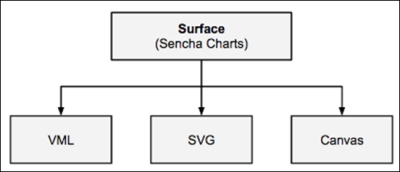
Sencha Charts offers complete charting capability with built-in charts to serve your data visualization needs. While we will look at the different out-of-box charts and their extensions in subsequent chapters, here we will look at their abstraction class—Ext.draw.Surface—which abstracts the underlying API differences across browsers and provides a single consistent API, which renders drawings on SVG, Canvas, or VML based on what the underlying browser supports. The following diagram depicts the Surface class that translates its APIs to the underlying VML, SVG, or Canvas APIs based on the browser support:
To demonstrate the Surface API and its benefits, let's create a project using Sencha Cmd by running the following command:
sencha generate app SCE /path/to/application/folder
Modify your app.json file to add Sencha Charts support to your project by adding sencha-charts to the requires config. After this, refresh the application by running the following command so that Sencha Charts package is included into the application:
sencha app refresh
Sencha Cmd will generate a Main view class inside the app/view/main folder, which is the initial view rendered on the screen. Replace the content of the file with the following code to show the axes:
Ext.define('SCE.view.main.Main', {
extend: 'Ext.container.Container',
xtype: 'app-main',
height: 850,
width: 850,
items: [{
xtype: 'draw',
title: 'Chart',
height: 500,
width: 500
}],
createLine: function(x1, y1, x2, y2, sw) {
return {
type: 'path',
stroke: 'black',
path: 'M' + x1 + ',' + y1 + ' L' + x2 + ',' + y2,
lineWidth: sw ? sw : 2
};
},
createPath: function(p, stroke, fill, opacity) {
return {
type: 'path',
path: p,
stroke: stroke ? stroke : 'black',
lineWidth: 2,
fillStyle: fill ? fill : 'none',
fillOpacity: opacity ? opacity : 1
};
},
createAxis: function(x1, y1, x2, y2, direction) {
var line = this.createLine(x1, y1, x2, y2);
var ah;
//draw arrow head
if (direction === "v") {
var p = 'M' + x1 + ',' + y2 + ' L' + (x1 - 10*Math.sin(Math.PI/4)) + ',' + (this.maxY + 10*Math.cos(Math.PI/4));
p += ' M' + x1 + ',' + y2 + ' L' + (x1 + 10*Math.sin(Math.PI/4)) + ',' + (this.maxY + 10*Math.cos(Math.PI/4));
ah = this.createPath(p);
}
if (direction === "h") {
var p = 'M' + x2 + ',' + y1 + ' L' + (this.maxX - 10*Math.cos(Math.PI/4)) + ',' + (this.maxX - 10*Math.sin(Math.PI/4));
p += ' M' + x2 + ',' + y1 + ' L' + (this.maxX - 10*Math.cos(Math.PI/4)) + ',' + (this.maxX + 10*Math.sin(Math.PI/4));
ah = this.createPath(p);
}
var axis = Ext.create('Ext.draw.sprite.Composite', {});
axis.add(line);
axis.add(ah);
return axis;
},
afterRender: function() {
var samples = [100, 250, 175],
gutter = 50,
barWidth = 50,
x0 = 50,
y0 = 400,
markerRadius = 10;
var drawCt = this.down('draw');
var surface = drawCt.getSurface();
//draw axes
this.maxX = x0 + samples.length*(barWidth + gutter) + gutter;
this.maxY = y0 - 250 - 50;
surface.add(this.createAxis(x0, y0, this.maxX, y0, 'h'));
surface.add(this.createAxis(x0, y0, x0, this.maxY, 'v'));
this.callParent(arguments);
}
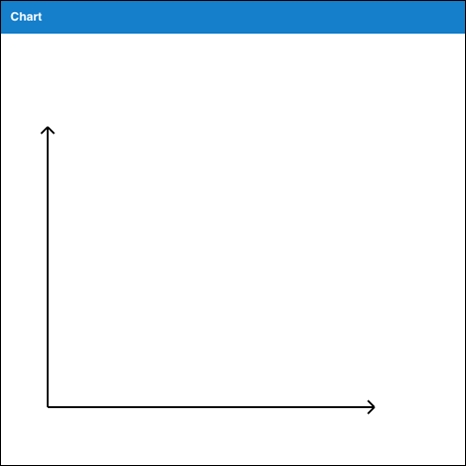
});The preceding code creates a container with a draw component that shows the x and y axes. The draw component contains the surface object that offers drawing APIs.
The createLine method creates a line using the path sprite. The createPath method creates a path using the path sprite. This is used to create the arrowhead of the axis.
The following code snippet creates two axes and adds them to the surface. The Surface class internally and uses VML/SVG/Canvas APIs to render the drawing on the screen:
surface.add(this.createAxis(x0, y0, this.maxX, y0, 'h'));
surface.add(this.createAxis(x0, y0, x0, this.maxY, 'v'));
The following screenshot shows the output produced by the preceding code:
Let's add a member method to the SCE.view.main.Main class to create the axis label. The following method uses the text sprite to create a label:
createLabel: function(x, y, txt) {

       return {
           type: 'text',
           x: x,
           y: y,
           text: txt,
           font: '1.1em arial italic'
       };

   }
The createBar member method uses a rectangle sprite to create a bar for our bar chart.
   createBar: function(x, y, w, h) {
       return {
           type: 'rect',
           x: x,
           y: y,
           width: w,
           height: h,
           fillStyle: '#E13987',
           stroke: '#E13987',
           lineWidth: 2
       };
   }
The following member method creates a marker at the specified coordinate:
createMarker: function(cx, cy, r) {
return {
type: 'circle',
cx: cx,
cy: cy,
r: r,
fillStyle: '#6F5092',
stroke: '#6F5092',
lineWidth: 2
};
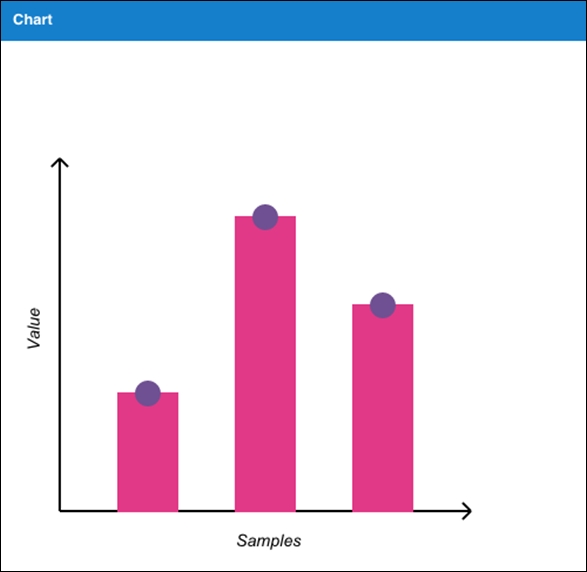
}Now, let's add the following code to the afterRender method, before the this.callParent() call, to draw the axis label and bars with markers:
//create axis label
var xLabel = this.createLabel(this.maxX/2, y0 + 30, 'Samples');
var yLabel = this.createLabel(x0 - 40, y0 - (y0 - this.maxY)/2, 'Value');
yLabel.rotationRads = -Math.PI/2;

surface.add(xLabel);
surface.add(yLabel);

//draw bars
for (var i=0; i<samples.length; i++) {
   var x, y, w = barWidth, h = samples[i];
   x = x0 + gutter + i*(w + gutter);
   y = y0 - h;

   var bar = this.createBar(x, y, w, h);
   var marker = this.createMarker(x + w/2, y, markerRadius);

   surface.add(bar);
   surface.add(marker);

}
Refreshing the URL in the browser, the code will produce the following output:
To create the area chart, add the following code to the afterRender member method before the this.callParent() call:
//draw area chart
var areaSamples = [20, 30, 20, 100, 140, 80, 40, 30, 60, 10, 75];
var n = areaSamples.length;
var gutter = (this.maxX - x0)/n;
var start = true;
var p = '';
for (var i=0; i<n; i++) {
var x = x0 + i*gutter , y = y0 - areaSamples[i];
if (start) {
p += 'M' + x + ',' + y;
start = false;
}
p += ' L' + x + ',' + y;
}
//area - with border
var area = this.createPath(p, '#00904B');
surface.add(area);
//fill the area chart
p += ' L' + x + ',' + y0 + ' L' + x0 + ',' + y0 + ' Z';
var fillArea = this.createPath(p,'none','#64BD4F', 0.5);
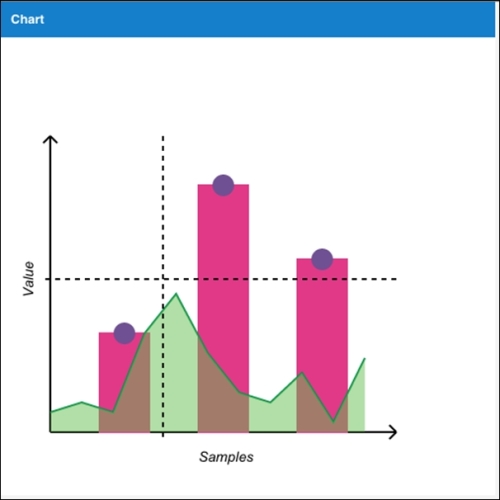
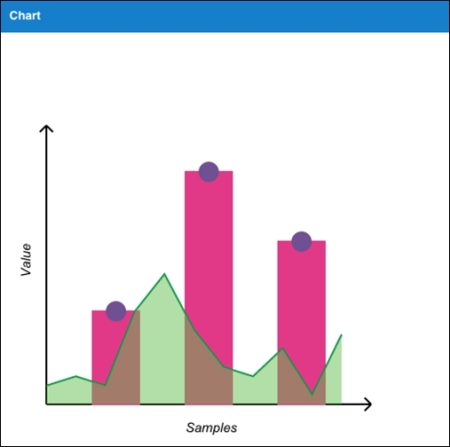
surface.add(fillArea);The following screenshot shows the output produced after the preceding code is added:
The last item is creating the crosshair. The following code adds two lines to the overlay surface and then the mousemove handler changes its position by setting its path attributes:
//show cross-hair
var overlay = drawCt.getSurface('overlay');
var hl, vl, headerOffset;

hl = this.createLine(-x0, -y0, -x0, -y0);
vl = this.createLine(-x0, -y0, -x0, -y0);
hl.lineDash = [5,5];
vl.lineDash = [5,5];
hl = overlay.add(hl);
vl = overlay.add(vl);
this.getEl().addListener('mousemove', function(evt, target) {
   var x = evt.getX(),
       y = evt.getY();

   //don't show the cross-hair if we are outside the chart area
   if (x < x0 || x > this.maxX || y < this.maxY || y > y0) {
       return;
   }

   headerOffset = drawCt.getHeader().getHeight();

   hl.setAttributes({
       path: 'M' + (x0 - 5) + ',' + (y - headerOffset) + ' L' + this.maxX + ',' + (y - headerOffset)
   });

   vl.setAttributes({
       path: 'M' + x + ',' + this.maxY + ' L' + x + ',' + (y0 + 10)
   });

   overlay.renderFrame();
}, this);
The overlay surface sits on top of the main surface that we used earlier to draw the axes, bar, area chart, and so on. We will discuss in more detail the different types of surfaces when we get to Chapter 3, Sencha Charts Architecture.