Book Image

Jupyter for Data Science

By : Dan Toomey
Book Image

Jupyter for Data Science

By: Dan Toomey

Overview of this book

Jupyter Notebook is a web-based environment that enables interactive computing in notebook documents. It allows you to create documents that contain live code, equations, and visualizations. This book is a comprehensive guide to getting started with data science using the popular Jupyter notebook. If you are familiar with Jupyter notebook and want to learn how to use its capabilities to perform various data science tasks, this is the book for you! From data exploration to visualization, this book will take you through every step of the way in implementing an effective data science pipeline using Jupyter. You will also see how you can utilize Jupyter's features to share your documents and codes with your colleagues. The book also explains how Python 3, R, and Julia can be integrated with Jupyter for various data science tasks. By the end of this book, you will comfortably leverage the power of Jupyter to perform various tasks in data science successfully.
Table of Contents (17 chapters)
Title Page
Credits
About the Author
About the Reviewers
www.PacktPub.com
Customer Feedback
Preface

Using SparkSession and SQL


Spark exposes many SQL-like actions that can be taken upon a data frame. For example, we could load a data frame with product sales information in a CSV file:

from pyspark.sql import SparkSession spark = SparkSession(sc) df = spark.read.format("csv") \        .option("header", "true") \        .load("productsales.csv");df.show()

The example:

  • Starts a SparkSession (needed for most data access)
  • Uses the session to read a CSV formatted file, that contains a header record
  • Displays initial rows

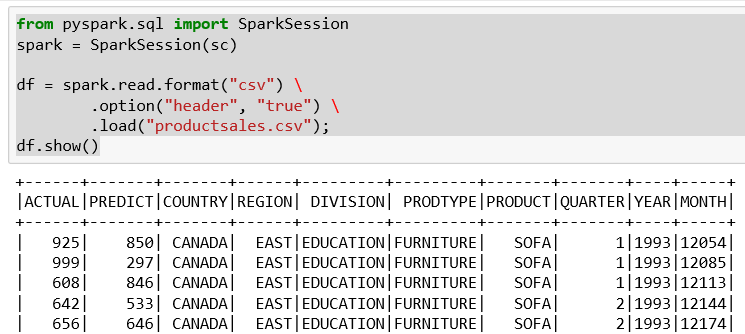
We have a few interesting columns in the sales data:

  • Actual sales for the products by division
  • Predicted sales for the products by division

If this were a bigger file, we could use SQL to determine the extent of the product list. Then the following is the Spark SQL to determine the product list:

df.groupBy("PRODUCT").count().show()

The data frame groupBy function works very similar to the SQL Group By clause. Group By collects the items in the dataset according to the values in the column...