Book Image

Learning Responsive Data Visualization

By : Erik Hanchett, Christoph Körner
Book Image

Learning Responsive Data Visualization

By: Erik Hanchett, Christoph Körner

Overview of this book

Using D3.js and Responsive Design principles, you will not just be able to implement visualizations that look and feel awesome across all devices and screen resolutions, but you will also boost your productivity and reduce development time by making use of Bootstrap—the most popular framework for developing responsive web applications. This book teaches the basics of scalable vector graphics (SVG), D3.js, and Bootstrap while focusing on Responsive Design as well as mobile-first visualizations; the reader will start by discovering Bootstrap and how it can be used for creating responsive applications, and then implement a basic bar chart in D3.js. You will learn about loading, parsing, and filtering data in JavaScript and then dive into creating a responsive visualization by using Media Queries, responsive interactions for Mobile and Desktop devices, and transitions to bring the visualization to life. In the following chapters, we build a fully responsive interactive map to display geographic data using GeoJSON and set up integration testing with Protractor to test the application across real devices using a mobile API gateway such as AWS Device Farm. You will finish the journey by discovering the caveats of mobile-first applications and learn how to master cross-browser complications.
Table of Contents (16 chapters)
Learning Responsive Data Visualization
Credits
About the Author
About the Reviewer
www.PacktPub.com
Preface
Index

Creating Scales and Axis


D3 is often mistaken for a charting library, which is not really correct. D3 provides loads of built-in functions to easily create interactive charts; however, it is not a charting library. One of these typical built-in charting helpers are the closely related Scales and axis generators. You will learn about them in this section.

At the end of this section, we want to be able to draw a simple axis as the one in the following figure. Therefore, we need to scale our dataset to a specific pixel range (using Scales) and create all the SVG elements for the axis (using axis generators):
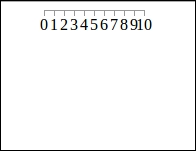
Axis in D3

Mapping data values to a Pixel Range with scales

The concept of scales is very important when we deal with graphics and visualization. It is a common task to scale values from a certain domain to a certain range of pixels. We need them to create tick values on axes, and we need them to scale our data points to the area of the chart.

The following figure explains the problem a little...