Book Image

Mastering IPython 4.0

By : Thomas Bitterman, Dipanjan Deb
Book Image

Mastering IPython 4.0

By: Thomas Bitterman, Dipanjan Deb

Overview of this book

IPython is an interactive computational environment in which you can combine code execution, rich text, mathematics, plots, and rich media. This book will get IPython developers up to date with the latest advancements in IPython and dive deep into interactive computing with IPython. This an advanced guide on interactive and parallel computing with IPython will explore advanced visualizations and high-performance computing with IPython in detail. You will quickly brush up your knowledge of IPython kernels and wrapper kernels, then we'?ll move to advanced concepts such as testing, Sphinx, JS events, interactive work, and the ZMQ cluster. The book will cover topics such as IPython Console Lexer, advanced configuration, and third-party tools. By the end of this book, you will be able to use IPython for interactive and parallel computing in a high-performance computing environment.
Table of Contents (18 chapters)
Mastering IPython 4.0
Credits
About the Author
About the Reviewer
www.PacktPub.com
Preface
6
Works Well with Others – IPython and Third-Party Tools
Index

Being graphic


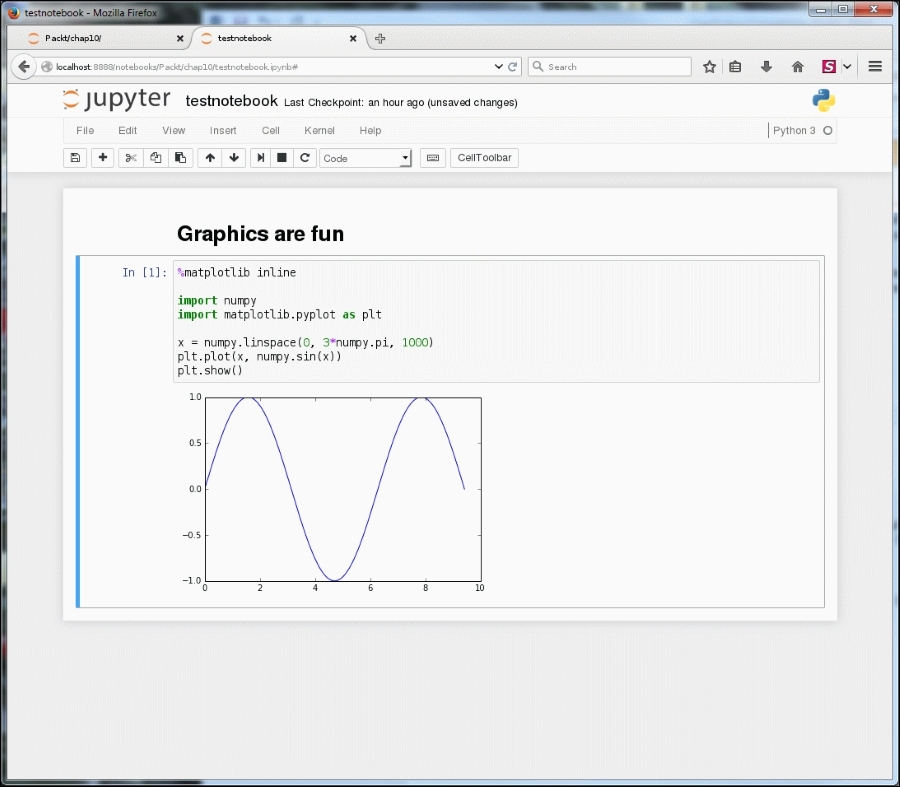
It would be a waste of time and energy to just use a web browser as a command line. The primary purpose of Jupyter is its usage as a lab notebook, which requires the ability to display visual information. To this end, an important feature of Jupyter is its seamless integration with the graphical capabilities of a browser.

This section will provide examples of using the plotting software from Chapter 7, Seeing Is Believing – Visualization in Jupyter. For the most part, displaying plots in Jupyter is easier done than said, with only minor modifications required to specify output to the notebook rather than IPython.

Using matplotlib

The key to using matplotlib in a notebook is the %matplotlib inline magic. It should be the first line in the cell. For example:

The first cell (which prints Graphics are fun) is Markdown; the second cell creates the plot shown.

Using Bokeh

The key to making Bokeh work with the notebook is to use the output_notebook( ) method instead of output_file( )....