
Regression is the process of estimating the relationship between input data and the continuous-valued output data. This data is usually in the form of real numbers, and our goal is to estimate the underlying function that governs the mapping from the input to the output. Let's start with a very simple example. Consider the following mapping between input and output:
1 --> 2
3 --> 6
4.3 --> 8.6
7.1 --> 14.2
If I ask you to estimate the relationship between the inputs and the outputs, you can easily do this by analyzing the pattern. We can see that the output is twice the input value in each case, so the transformation would be as follows:
f(x) = 2x
This is a simple function, relating the input values with the output values. However, in the real world, this is usually not the case. Functions in the real world are not so straightforward!
Linear regression refers to estimating the underlying function using a linear combination of input variables. The preceding example was an example that consisted of one input variable and one output variable.
Consider the following figure:
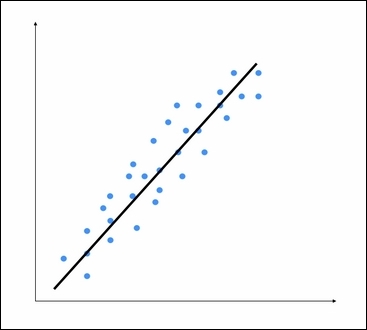
The goal of linear regression is to extract the underlying linear model that relates the input variable to the output variable. This aims to minimize the sum of squares of differences between the actual output and the predicted output using a linear function. This method is called Ordinary least squares.
You might say that there might be a curvy line out there that fits these points better, but linear regression doesn't allow this. The main advantage of linear regression is that it's not complex. If you go into nonlinear regression, you may get more accurate models, but they will be slower. As shown in the preceding figure, the model tries to approximate the input datapoints using a straight line. Let's see how to build a linear regression model in Python.
You have been provided with a data file, called data_singlevar.txt. This contains comma-separated lines where the first element is the input value and the second element is the output value that corresponds to this input value. You should use this as the input argument:
Create a file called
regressor.py, and add the following lines:import sys import numpy as np filename = sys.argv[1] X = [] y = [] with open(filename, 'r') as f: for line in f.readlines(): xt, yt = [float(i) for i in line.split(',')] X.append(xt) y.append(yt)We just loaded the input data into
Xandy, whereXrefers to data andyrefers to labels. Inside the loop in the preceding code, we parse each line and split it based on the comma operator. We then convert it into floating point values and save it inXandy, respectively.When we build a machine learning model, we need a way to validate our model and check whether the model is performing at a satisfactory level. To do this, we need to separate our data into two groups: a training dataset and a testing dataset. The training dataset will be used to build the model, and the testing dataset will be used to see how this trained model performs on unknown data. So, let's go ahead and split this data into training and testing datasets:
num_training = int(0.8 * len(X))
num_test = len(X) - num_training

# Training data
X_train = np.array(X[:num_training]).reshape((num_training,1))
y_train = np.array(y[:num_training])

# Test data
X_test = np.array(X[num_training:]).reshape((num_test,1))
y_test = np.array(y[num_training:])
Here, we will use 80% of the data for the training dataset and the remaining 20% for the testing dataset.
We are now ready to train the model. Let's create a regressor object, as follows:
from sklearn import linear_model

# Create linear regression object
linear_regressor = linear_model.LinearRegression()

# Train the model using the training sets
linear_regressor.fit(X_train, y_train)
We just trained the linear regressor, based on our training data. The fit method takes the input data and trains the model. Let's see how it fits:
import matplotlib.pyplot as plt

y_train_pred = linear_regressor.predict(X_train)
plt.figure()
plt.scatter(X_train, y_train, color='green')
plt.plot(X_train, y_train_pred, color='black', linewidth=4)
plt.title('Training data')
plt.show()
We are now ready to run the code using the following command:
$ python regressor.py data_singlevar.txtYou should see the following figure:
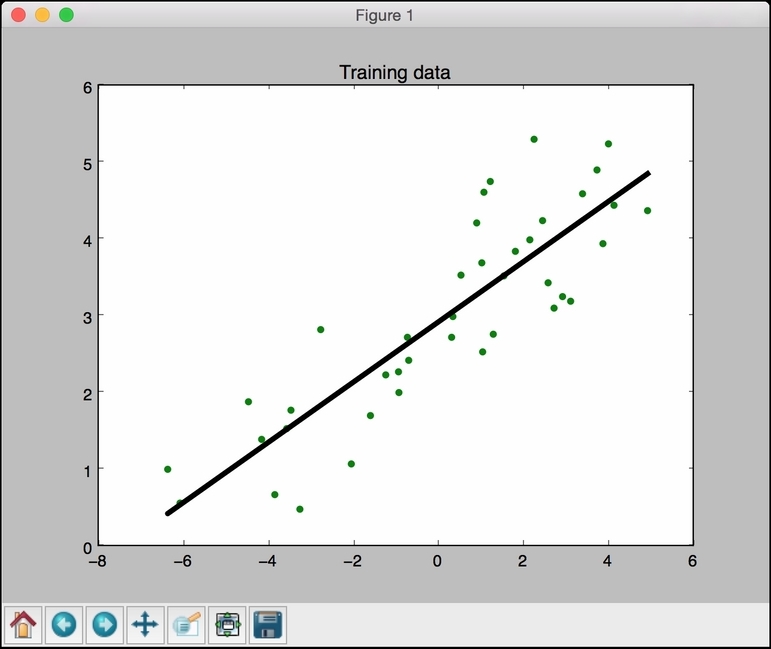
In the preceding code, we used the trained model to predict the output for our training data. This wouldn't tell us how the model performs on unknown data because we are running it on training data itself. This just gives us an idea of how the model fits on training data. Looks like it's doing okay as you can see in the preceding figure!
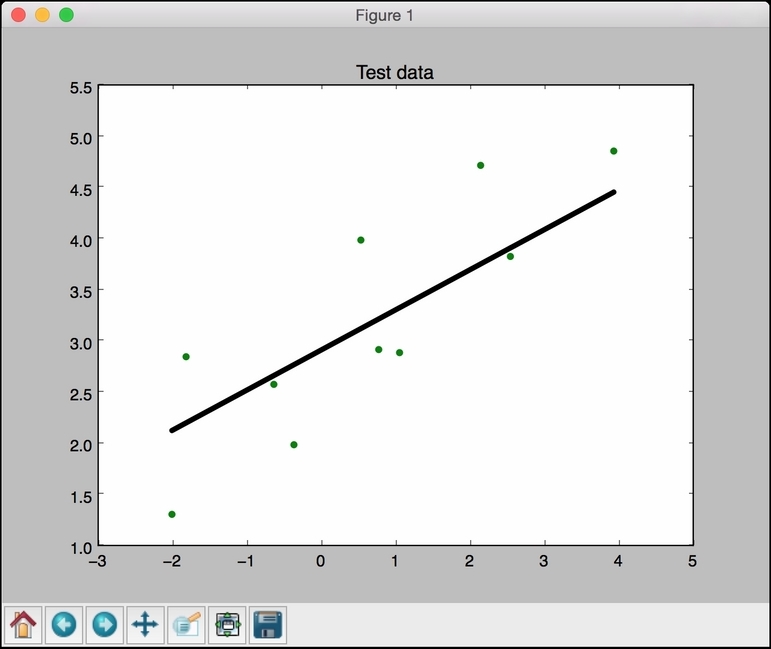
Let's predict the test dataset output based on this model and plot it, as follows:
y_test_pred = linear_regressor.predict(X_test)

plt.scatter(X_test, y_test, color='green')
plt.plot(X_test, y_test_pred, color='black', linewidth=4)
plt.title('Test data')
plt.show()
If you run this code, you will see a graph like the following one: