

Before we start installing any software, we need to understand the repeatable set of steps that we will use for data analysis throughout the book.
The following are the five key steps for data analysis:
- Acquisition: The first step in the pipeline is to acquire the data from a variety of sources, including relational databases, NoSQL and document stores, web scraping, and distributed databases such as HDFS on a Hadoop platform, RESTful APIs, flat files, and hopefully this is not the case, PDFs.
- Exploration and understanding: The second step is to come to an understanding of the data that you will use and how it was collected; this often requires significant exploration.
- Munging, wrangling, and manipulation: This step is often the single most time-consuming and important step in the pipeline. Data is almost never in the needed form for the desired analysis.
- Analysis and modeling: This is the fun part where the data scientist gets to explore the statistical relationships between the variables in the data and pulls out his or her bag of machine learning tricks to cluster, categorize, or classify the data and create predictive models to see into the future.
- Communicating and operationalizing: At the end of the pipeline, we need to give the data back in a compelling form and structure, sometimes to ourselves to inform the next iteration, and sometimes to a completely different audience. The data products produced can be a simple one-off report or a scalable web product that will be used interactively by millions.
Although the preceding list is a numbered list, don't assume that every project will strictly adhere to this exact linear sequence. In fact, agile data scientists know that this process is highly iterative. Often, data exploration informs how the data must be cleaned, which then enables more exploration and deeper understanding. Which of these steps comes first often depends on your initial familiarity with the data. If you work with the systems producing and capturing the data every day, the initial data exploration and understanding stage might be quite short, unless something is wrong with the production system. Conversely, if you are handed a dataset with no background details, the data exploration and understanding stage might require quite some time (and numerous non-programming steps, such as talking with the system developers).
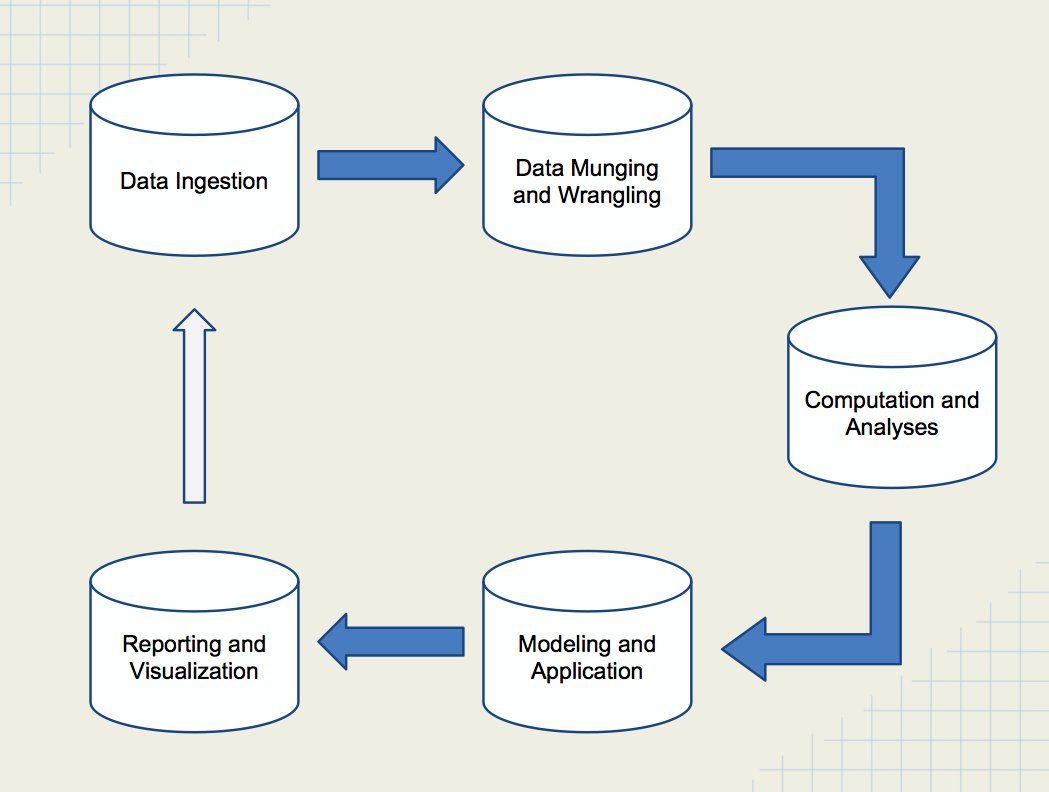
The following diagram shows the data science pipeline:
As you have probably heard or read by now, data munging or wrangling can often consume 80 percent or more of project time and resources. In a perfect world, we would always be given perfect data. Unfortunately, this is never the case, and the number of data problems that you will see is virtually infinite. Sometimes, a data dictionary might change or might be missing, so understanding the field values is simply not possible. Some data fields may contain garbage or values that have been switched with another field. An update to the web app that passed testing might cause a little bug that prevents data from being collected, causing a few hundred thousand rows to go missing. If it can go wrong, it probably did at some point; the data you analyze is the sum total of all of these mistakes.
The last step, communication and operationalization, is absolutely critical, but with intricacies that are not often fully appreciated. Note that the last step in the pipeline is not entitled data visualization and does not revolve around simply creating something pretty and/or compelling, which is a complex topic in itself. Instead, data visualizations will become a piece of a larger story that we will weave together from and with data. Some go even further and say that the end result is always an argument as there is no point in undertaking all of this effort unless you are trying to persuade someone or some group of a particular point.