

In order to find out how data and variables are mapped in regard to the principal component, you can use biplot, which plots data and the projections of original features on to the first two components. In this recipe, we will demonstrate how to use biplot to plot both variables and data on the same figure.
Ensure that you have completed the previous recipe by generating a principal component object and save it in the variable, swiss.pca.
Perform the following steps to create a biplot:
- You can create a scatter plot using component 1 and 2:
         > plot(swiss.pca$x[,1], swiss.pca$x[,2], xlim=c(-4,4))
         > text(swiss.pca$x[,1], swiss.pca$x[,2], rownames(swiss.pca$x),
cex=0.7, pos=4, col="red") 
The scatter plot of first two components from PCA result
- If you would like to add features to the plot, you can create a
biplotusing the generated principal component object:
> biplot(swiss.pca)
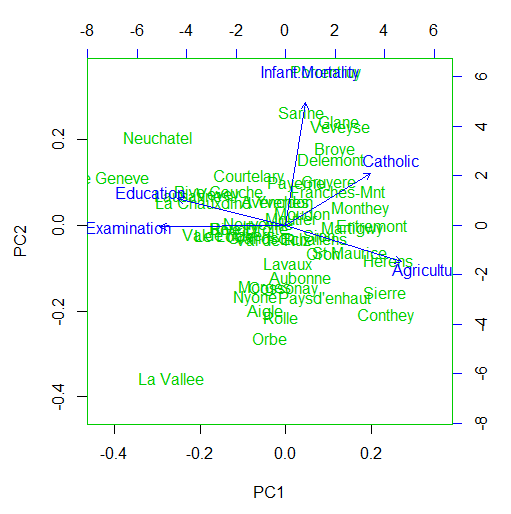
A biplot...