Book Image

Java Data Analysis

By : John R. Hubbard
Book Image

Java Data Analysis

By: John R. Hubbard

Overview of this book

Data analysis is a process of inspecting, cleansing, transforming, and modeling data with the aim of discovering useful information. Java is one of the most popular languages to perform your data analysis tasks. This book will help you learn the tools and techniques in Java to conduct data analysis without any hassle. After getting a quick overview of what data science is and the steps involved in the process, you’ll learn the statistical data analysis techniques and implement them using the popular Java APIs and libraries. Through practical examples, you will also learn the machine learning concepts such as classification and regression. In the process, you’ll familiarize yourself with tools such as Rapidminer and WEKA and see how these Java-based tools can be used effectively for analysis. You will also learn how to analyze text and other types of multimedia. Learn to work with relational, NoSQL, and time-series data. This book will also show you how you can utilize different Java-based libraries to create insightful and easy to understand plots and graphs. By the end of this book, you will have a solid understanding of the various data analysis techniques, and how to implement them using Java.
Table of Contents (20 chapters)
Java Data Analysis
Credits
About the Author
About the Reviewers
www.PacktPub.com
Customer Feedback
Preface
Index

Cosine similarity


If we think of each column y of the utility matrix as an n-dimensional vector, y = (y1, y2, ..., yn), then we can use the Euclidean dot product (inner product) formula to compute the cosine of the angle θ that the two vectors make at the origin:

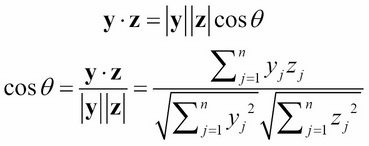
This is called the cosine similarity measure:

For example, if y = (2, 1, 3) and z = (1, 3, 2), then:

We can see that the cosine similarity measure has the six requisite properties for a similarity measure. If u and v are parallel, then s(y, z) = cos θ = cos 0 = 1. That would be the result in the case where y = (2, 1, 2) and z = (4, 2, 4). On the other hand, if y = (2, 0, 2) and z = (0, 4, 0), then y and z are perpendicular and s(y, z) = cos θ = cos 90º = 0.

We can interpret these extremes in terms of a utility matrix. If y = (2, 1, 2) and z = (4, 2, 4), then z = 2y. They are very similar in that all three of the users rated item z twice as high as item y. But in the second example of (2, 0, 2) and (0, 4, 0), we can detect no similarity...