Book Image

Big Data Analytics with Java

By : RAJAT MEHTA
Book Image

Big Data Analytics with Java

By: RAJAT MEHTA

Overview of this book

This book covers case studies such as sentiment analysis on a tweet dataset, recommendations on a movielens dataset, customer segmentation on an ecommerce dataset, and graph analysis on actual flights dataset. This book is an end-to-end guide to implement analytics on big data with Java. Java is the de facto language for major big data environments, including Hadoop. This book will teach you how to perform analytics on big data with production-friendly Java. This book basically divided into two sections. The first part is an introduction that will help the readers get acquainted with big data environments, whereas the second part will contain a hardcore discussion on all the concepts in analytics on big data. It will take you from data analysis and data visualization to the core concepts and advantages of machine learning, real-life usage of regression and classification using Naïve Bayes, a deep discussion on the concepts of clustering,and a review of simple neural networks on big data using deepLearning4j or plain Java Spark code. This book is a must-have book for Java developers who want to start learning big data analytics and want to use it in the real world.
Table of Contents (21 chapters)
Big Data Analytics with Java
Credits
About the Author
About the Reviewers
www.PacktPub.com
Customer Feedback
Preface
Free Chapter
1
Big Data Analytics with Java
8
Ensembling on Big Data
12
Real-Time Analytics on Big Data
Index

SVM or Support Vector Machine


This is another popular algorithm that is used in many real life applications like text categorization, image classification, sentiment analysis and handwritten digit recognition. Support vector machine algorithm can be used both for classification as well as for regression. Spark has the implementation for linear SVM which is a binary classifier. If the datapoints are plotted on a chart the SVM algorithm creates a hyperplane between the datapoints. The algorithm finds the closest points with different labels within the dataset and it plots the hyperplane between those points. The location of the hyperplane is such that it is at maximum distance from these closest points, this way the hyperplane would nicely bifurcate the data. To figure out this maximum distance for the location of the hyperplane the SVM algorithm uses a kernel function (mathematical function).

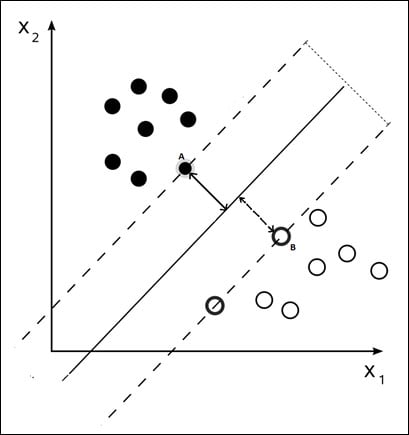
As you can see in the image we have two different type of datapoints one clustered on the X2 axis...