Book Image

Learning SAP Analytics Cloud

Book Image

Learning SAP Analytics Cloud

Overview of this book

The book starts with the basics of SAP Analytics Cloud (formerly known as SAP BusinessObjects Cloud) and exposes almost every significant feature a beginner needs to master. Packed with illustrations and short, essential, to-the-point descriptions, the book provides a unique learning experience. Your journey of exploration starts with a basic introduction to the SAP Analytics Cloud platform. You will then learn about different segments of the product, such as Models, Stories, Digital Boardroom, and so on. Then, you are introduced to the product's interface: the Home screen, the main menu, and more. Then comes the hands-on aspect of the book, which starts with model creation. Next, you learn how to utilize a model to prepare different types of stories(reports) with the help of charts, tables, Geo Maps, and more. In the final chapters of this book, you will learn about Digital Boardroom, Collaboration, and Administration.
Table of Contents (11 chapters)

Linking different models

In your stories, you can display data from multiple models in a single chart by linking dimensions in those models. In this exercise, you will link the two models (BestRun_Demo and Planned_Events) to view the data from both models in a scatter plot chart.

Here are the steps to link dimensions:

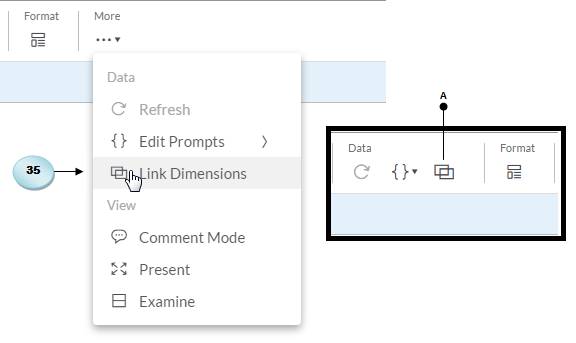
  1. Click on the Link Dimensions option in the More menu. On wider screens, this option is listed in the data toolbar section (A). Alternatively, you can find this option in the Data Source area of the Builder panel when you are creating or editing a chart:
  1. The Link Dimensions dialog box appears. In this dialog box, you have to link dimension from the primary model on the left with those from the secondary model on the right. Expand the drop-down list in the left pane, and click on the Add model option. In the Select Models To Add dialog box, select the existing...