Book Image

Learning SAP Analytics Cloud

Book Image

Learning SAP Analytics Cloud

Overview of this book

The book starts with the basics of SAP Analytics Cloud (formerly known as SAP BusinessObjects Cloud) and exposes almost every significant feature a beginner needs to master. Packed with illustrations and short, essential, to-the-point descriptions, the book provides a unique learning experience. Your journey of exploration starts with a basic introduction to the SAP Analytics Cloud platform. You will then learn about different segments of the product, such as Models, Stories, Digital Boardroom, and so on. Then, you are introduced to the product's interface: the Home screen, the main menu, and more. Then comes the hands-on aspect of the book, which starts with model creation. Next, you learn how to utilize a model to prepare different types of stories(reports) with the help of charts, tables, Geo Maps, and more. In the final chapters of this book, you will learn about Digital Boardroom, Collaboration, and Administration.
Table of Contents (11 chapters)

Working with tables

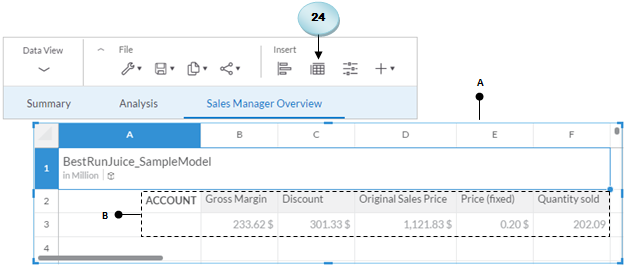
In this exercise, you will work with the table object that you will create on a canvas page and will go through the grid later in this chapter. Execute the following steps to create a table on your story page to evaluate this object:

  1. Click on the table icon on the Insert toolbar. A table object (A) will be added, populated with all the members from the Account dimension (B) in the BestRun model:
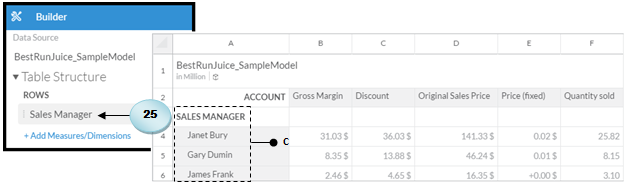
  1. In the Builder panel, click on the Add Measure/Dimensions link in the Rows section, and select the Sales Manager dimension. The table will be refreshed to show values from the selected dimension in the first table column (C). Also note that all the five measures are updated as well to show the corresponding values for each sales manager:
  1. Under the Columns section, click on the Add Measures/Dimensions link, and select the Date dimension. Once again, the table...