
Executing a program from a text file is the most time-honored approach to running computer code. Since Python is an interpreted language, text files meant to be run with Python are called scripts. Scripts are an easy way to share and distribute your programs, since all code is encapsulated in a number of files that can be easily copied to another user's computer.
Running SciPy in a script
Getting ready
To follow this recipe, you need a text editor and and a Terminal window. The Terminal window must be open on the directory where your script is saved.
How to do it...
Running a script in Python is only a matter of typing the code with a text editor and running it using the Python interpreter. Enter the following sample code into the text editor:
import numpy as np
from mpl_toolkits.mplot3d import Axes3D
import matplotlib.pyplot as plt
from matplotlib import cm

plt.switch_backend('Qt5Agg')

fig = plt.figure()
ax = fig.gca(projection='3d')
ax.view_init(elev=25, azim=65)
xvalues = np.linspace(-4, 4, 40)
yvalues = np.linspace(-4, 4, 40)
xgrid, ygrid = np.meshgrid(xvalues, yvalues)
zvalues = xgrid**3 * ygrid + xgrid * ygrid**3
ax.plot_surface(xgrid, ygrid, zvalues, cmap=cm.coolwarm,
                linewidth=0, antialiased=True)

plt.show()
Save the script in a file named script_test.py. Open a Terminal window on the directory where the script was saved and execute the following command from the system prompt:
python3 script_test.py
Running the script will produce a three-dimensional plot similar to the one displayed in the following screenshot:
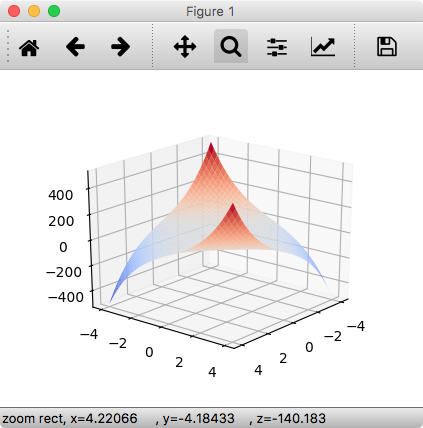
Image produced by running script_test.py
The image displayed is interactive, and can be rotated and panned with the mouse. It is also possible to save the image to the disk. Notice that the script is suspended while the image is being displayed. To continue execution of the script, simply close the image. In our example, this will cause the script to end.