
There are several image processing libraries written in Python for computer vision. For the purpose of this book we will look into scikit-image and pillow. These libraries will be used throughout this book to implement the algorithms that will be discussed. In the next section, you will be shown how to install these libraries and do some basic image processing operations to prepare you for the next chapters.
Pillow is an open source library that has been forked from the Python Imaging Library (PIL). Pillow is a very good starting point for beginners who want to start with implementing some basic algorithms before diving into the more complex ones. The book will use Pillow version 4.0.
Note
You can find more information on pillow at https://python-pillow.org/.
In this section, we will see how to install Pillow on different operating systems:
- Windows: Pillow can be installed on windows using pip. Open the command-line tool on your Windows machine and type in the following command and press Enter:
$: pip install PillowNote
pip already comes installed with Python 2>=2.7.9 and Python 3>=3.4. In case you do not have pip installed, follow the official instructions given at https://pip.pypa.io/en/stable/installing/#do-i-need-to-install-pip.
- OSX/macOS: For OSX/macOS, we will use Homebrew to install Pillow.
Note
Go to https://brew.sh/ for instructions on how to install Homebrew in case you do not have it installed.
Open the terminal on your Mac. First, install the dependencies and then pillow using the following commands:
        $: brew install libtiff libjpeg webp little-cms2
        $: pip install Pillow
If you have both Python2 and Python3 installed, then to install Pillow for Python3, use the following command:
$: python3 –m pip install Pillow- Linux: Use the
pipcommand to install pillow on a Linux operating system:
$: pip install PillowThis section will walk you through the basics of pillow using relevant code snippets.
To read an image from a jpg or a png file saved on your computer, Pillow's image module provides a read() function (Image.open). This function returns an image object, which contains information such as pixel type, image size, and image format. The following is an example of how to read an image. Note that the import statement is only run once at the beginning of the program:
>>> from PIL import Image
>>> img = Image.open("image.png")
To display the image on your screen, use the show() function as follows:
>>> img.show()
To write or save an image to a file on your computer, use the save() function associated to the image object. It takes in the absolute or relative file path to where you want to store the image:
>>> img.save("temp.png") # Example showing relative path
>>> img.save("/tmp/temp.png") # Example showing absolute path
Cropping an image means to extract a particular region of the image, which is smaller than the original image. This region in some books/references in called the Region of Interest (ROI). The concept of ROI is sometimes useful when you want to run your algorithm only on a particular part of the image and not the entire image. The image object has a crop() function that takes two coordinates--the upper-left corner and the bottom-right corner of the rectangle that you are interested in--and returns the cropped image:
>>> from PIL import Image
>>> dim = (100,100,400,400) #Dimensions of the ROI
>>> crop_img = img.crop(dim)
>>> crop_img.show()
The following images shows the crop function as used in the preceding code:
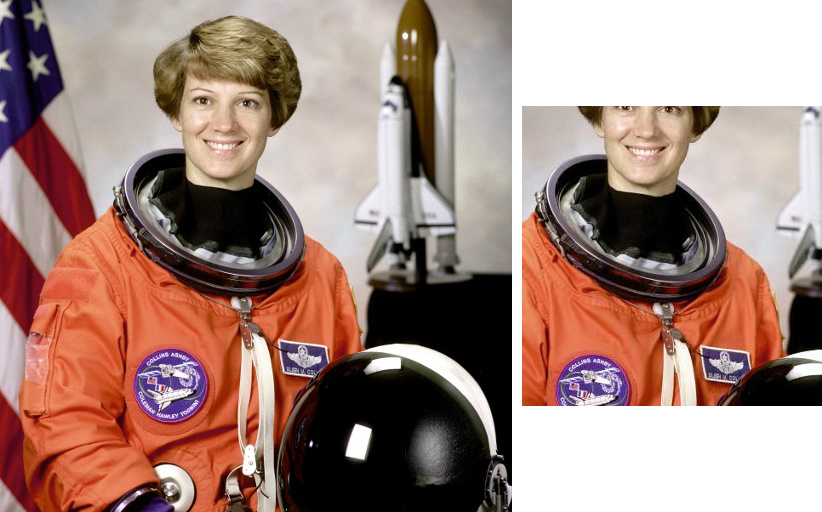
Figure 3: (Left) Original image and (right) a cropped region of the original image
Color spaces and channelsLike in the world of mathematics, we have different coordinate system: for example, a 2-D cartesian plane and 2-D polar coordinates. A point could be stored as (x, y) or (r, theta). Each coordinate system has a specific use case, which makes calculations easier. Similarly, in the world of image processing, we have different color spaces. An image can store its color values in the form of Red, Blue, Green (RGB) or it could as Cyan, Magenta, Yellow, Key(black) (CMYK). Some examples of other color spaces are HSV, HSL, CMY, and it goes on. Each value in the color space is called a color channel. For example, in the RGB color space we say that Red, Blue, and Green each are channels of the image. An image can be represented in many different modes (color spaces) such as RGB, CMYK, Grayscale, and YUV. The colors in the image that we see are derived by the mixture of the colors in each color channel of the color space. Let's look at some of the common color spaces in detail:
- Grayscale: This is one of the simplest color spaces both in terms of understanding and storing on a computer. Each pixel value in a grayscale image is a single value between 0 and 255, with 0 representing black and 255 representing white. Keep in mind that the value 255 is not a fixed value but depends on the depth of the image (image depth is covered in the next section). Grayscale images are also sometimes called black and white images but it is not entirely accurate. A black and white image means that the pixel values can only be either 0 or 255 and nothing in between.
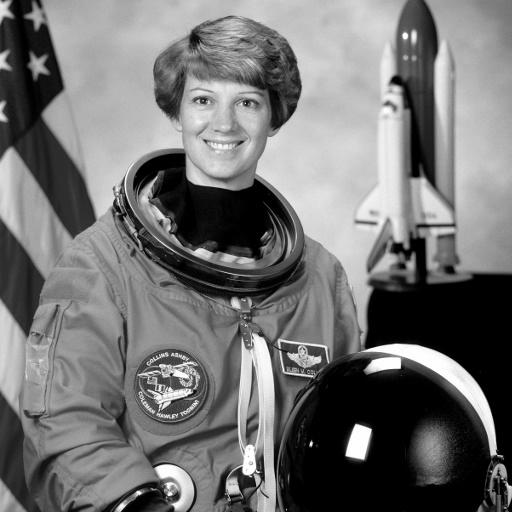
Figure 4 Example of a grayscale image
- Red, Green, Blue (RGB): This is one of the most common color spaces that is used in the image processing world and elsewhere. Most images that you view over the internet or in your books are in the RGB space. In a typical RGB image, each pixel is a combination of three values, each representing a color in red, green, and blue channels. White color in RGB space is written as (255, 255, 255) and black is written as (0, 0, 0). Red, green, and blue are represented by (255, 0, 0), (0, 255, 0), and (0, 0, 255) respectively. Any other color is just a combination of some values of red, green, and blue. Remember your painting class as a kid where you used to mix the primary colors to create a new color. It's that simple!
- Hue, Saturation, Value (HSV): This is a cylindrical coordinate system where we project RGB values onto a cylinder. Figure 5 further illustrates this concept. The HSV color space was designed keeping mind the unintuitive nature of the RGB space. There is no clear intuition to how the color progresses in the RGB space. The HSV scale handles this perfectly in the sense that you can fix the hue and then generate different shades of that hue by just varying values and saturation:
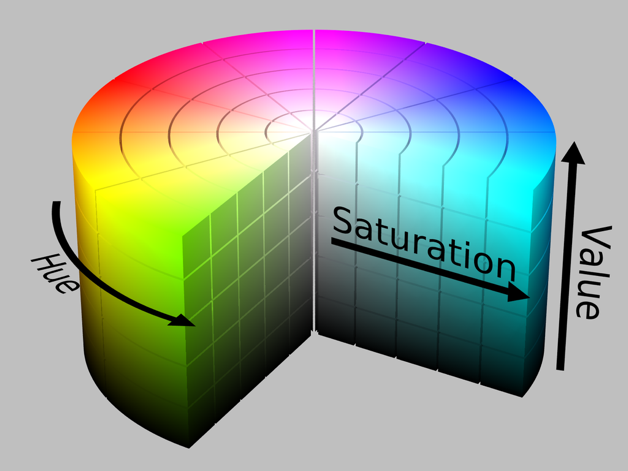
Figure 5: Illustration of HSV color space
Image source: By HSV_color_solid_cylinder.png: SharkDderivative work: SharkD Talk - HSV_color_solid_cylinder.png, CC BY-SA 3.0, https://commons.wikimedia.org/w/index.php?curid=9801673
At the beginning of the chapter, we said that an image is stored in the form of a 2D matrix. So how do we accommodate for the multiple channels in the image? Simple, we have multiple 2D matrices for each channel. A little exercise--how many matrices will a grayscale image have?
If you try to print the pixel value of a grayscale image, you will only get one value, but if you try to print the pixel value of an RGB image, then you will get three values; this shows that RGB has three channels, red, green, and blue and grayscale images have only one value.
In the following code snippet, we print the pixel values of an RGB image and a grayscale image:
>>> from PIL import Image
>>> img = Image.open("image.png")
>>> img.getpixel((100,100))
output
(150, 188, 233, 255)
>>> img.convert("L").getpixel((100,100))
This is the following output:
181
The following image shows the different color channels in an RGB image:
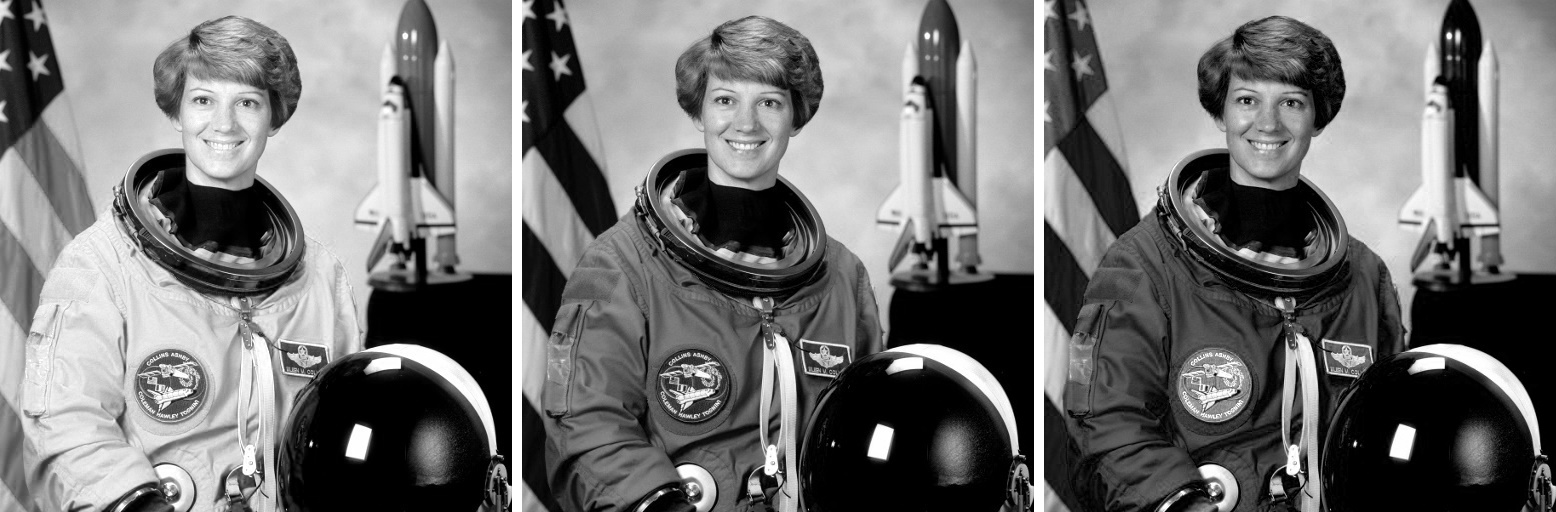
Figure 6: Red, green, and blue respectively
Image depth
Image depth or the color depth is the number of bits used to represent a color of a pixel. The image depth determines the range of colors an image can have. For example, if we have an image with a depth of 4 bits, then the pixel value will range from 0 to 15 (which is the biggest number we can store using 4 bits - 2^4 -1 = 15 ). Whereas if we use 8 bits, then the value will range from 0 to 255, providing a finer color spectrum. Another way of thinking about image depth is that the number of bits also determines the number of colors, which can be used in an image. For example, 1 bit implies two colors, 2 bits - four colors, and 8 bits - 256 colors.
Images can be converted from one color space to another using the convert function of the image module. To convert an image from RGB color space to grayscale color space, use the L mode. There are various other modes available such as 1 which is 1-bit pixel mode, P-8 bit pixel mode, RGB-3X8 bit pixel, and RGBA-4X8 bit pixel.
The following code snippet shows how to convert a color image to grayscale:
>>> from PIL import Image
>>> grayscale = img.convert("L")
>>> grayscale.show()
Note
The link to the documentation of the Pillow library is http://pillow.readthedocs.io/en/3.1.x/reference/Image.html#PIL.Image.Image.convert.
The following image shows the result of the preceding code (converting an image from RGB mode to grayscale mode):
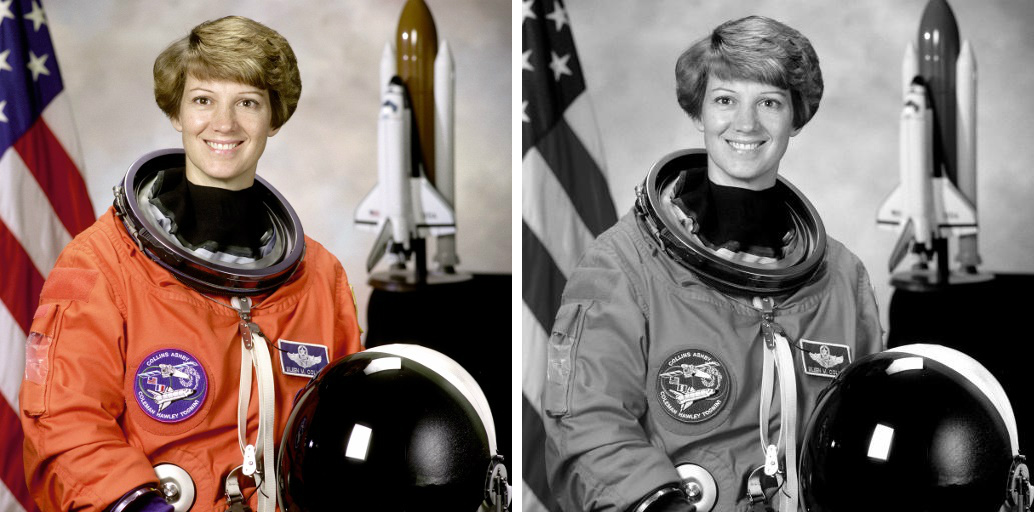
Figure 7: Output after converting from RGB mode to grayscale
There are times when you need to perform different types of transformations to images such as resize, rotate, and flip. Pillow provides direct functions to perform these transformations, saving you from having to write the code from scratch:
- Resize: To resize an image, use the
resize()function, which takes a tuple of the new size as an argument:
        >>> from PIL import Image
        >>> resize_img = img.resize((200,200))
>>> resize_img.show()- Rotate: To rotate an image, use the
rotate()function, which takes in the degrees to be rotated (counter clockwise) as an argument:
        >>> from PIL import Image
        >>> rotate_img = img.rotate(90)
        >>> rotate_img.show()
The result of the preceding code is shown in the following image:
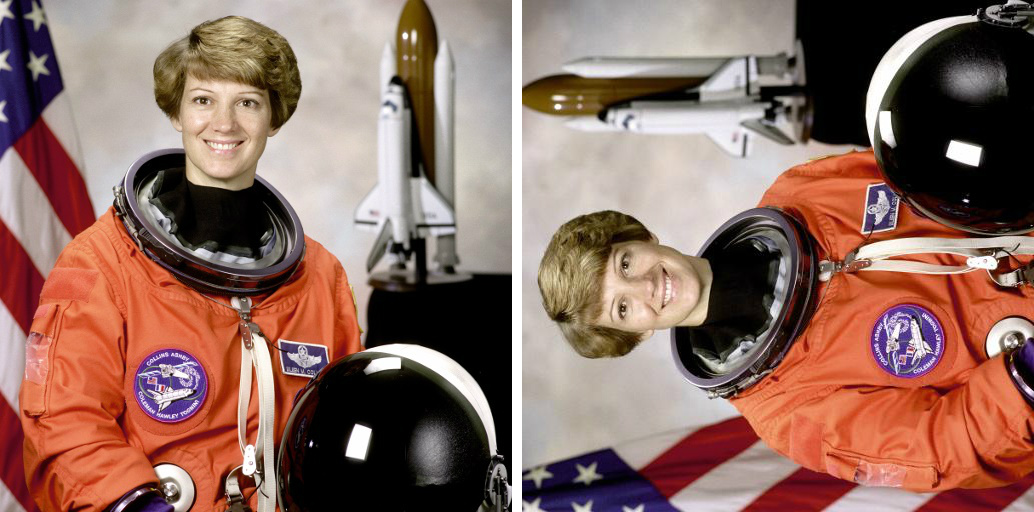
Figure 8: Output after rotating the image by 90 degrees
Image enhancement involves operations such as changing the contrast, brightness, color balance, or sharpness of an image. Pillow provides an ImageEnhance module, which has functions that can help you perform the earlier mentioned operations.
We will begin with importing the ImageEnhance module using the following code:
>>> from PIL import ImageEnhance
After importing the library, let us see how to use the functions available in the library. First we will see how to change the brightness of an image:
Change brightness of an image: We will use the following code to change the brightness:
        >>> enhancer = ImageEnhance.Brightness(img)
        >>> enhancer.enhance(2).show()
The enhance() function takes a float as an argument, which describes the factor which we want to change the brightness of the image. A factor value less than 1 will decrease the brightness and a factor value greater than 1 will increase the brightness of the image. A factor value equal to 1 will give the original image as output. The output of the enhance() function is an image with the changed brightness:
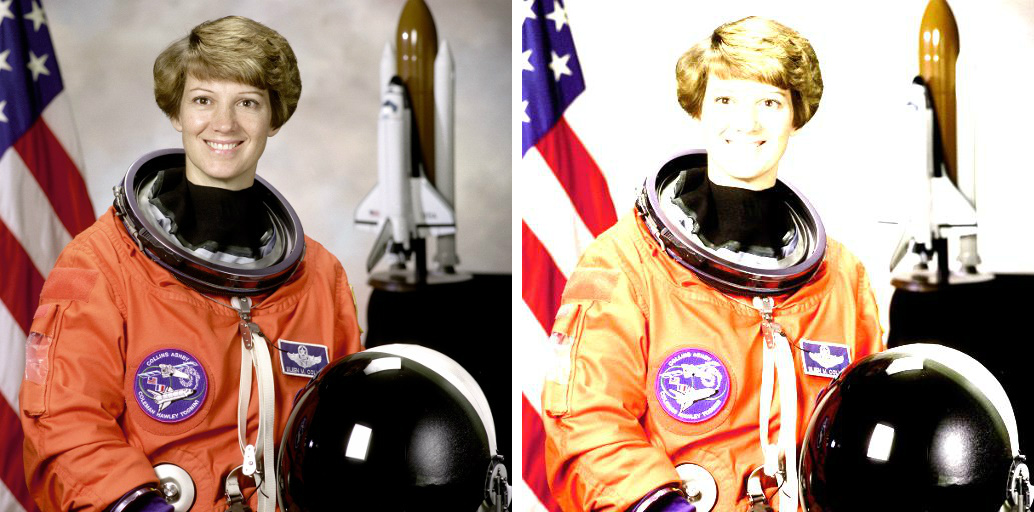
Figure 9: This image shows the increase in the brightness of the image - the image to the left is the original picture and the image to the right is the enhanced one
Next we will see how to change the contrast of an image.
- Changethecontrastof the image: The following code snippet shows how to enhance the contrast of a given image:
        >>> enhancer = ImageEnhance.Contrast(img)
        >>> enhancer.enhance(2).show()
Again the enhance() function takes a float argument. A factor equal to 1 will give you the original image, while a factor value less than 1 will decrease the contrast and greater than 1 will increase the contrast:
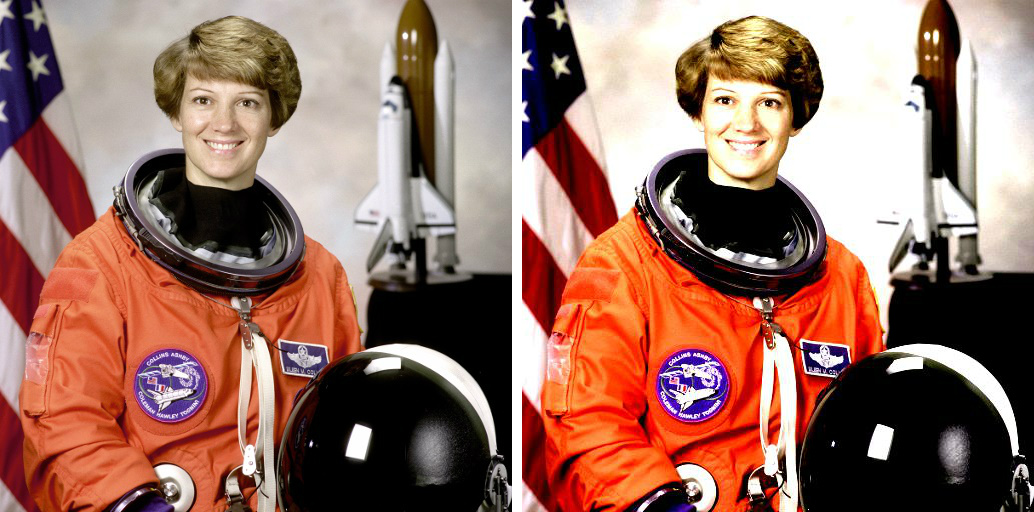
Figure 10: This figure shows the change in the contrast of the image - the image to the left is the original picture and the image to the right is the enhanced image
Accessing pixels of an imageSometimes for performing tasks such as thresholding (which will be covered later in the book), we have to access the individual pixels in an image. Pillow provides a PixelAccess class with functions to manipulate image pixel values. getpixel() and putpixel() are some of the functions in the PixelAccess class:
getpixel(): This function returns the color value of the pixel at the (x, y) coordinate. It takes a tuple as an argument and returns a tuple of color values:
>>> img.getpixel((100,100))
This is the following output:
(150, 188, 233, 255)
putpixel(): This function changes the color value of the pixel at the (x, y) coordinate to a new color value. Both the coordinates and the new color value are passed as an argument to the function. If the image has more than one band of colors, then a tuple is passed as an argument to the function:
        >>> img.putpixel((100,100),(20,230,145))
        >>> img.getpixel((100,100))
This is the following output:
(20, 230, 145,255)
So far we have looked at only integer values for the colors. Some libraries also work with float images where the pixel value lies between 0 and 1.
In this section, we will learn about another Python library for image processing, scikit-image, also represented as Skimage. An scikit-image provides more advanced operations as compared to Pillow and is suitable for building enterprise-scale applications.
Note
Here is the official website for scikit-image: http://scikit-image.org/
In this section we look at how to install scikit-image for Python 3 on different operating systems.
- OSX/macOS: For installing scikit-image on OSX/macOS, we will use pip. We have already seen how to use
pipwhile installing pillow:
        $: python3 -m pip install -U scikit-image
        $: python3 -m pip install scipy
        $: python3 -m pip install matplotlib
- Linux (Ubuntu): We will use the command-line interface in Linux systems to install scikit-image. Open the default terminal on your computer and type in the following command:
$: sudo apt-get install python3-skimage- Windows: Similar to what we did for the Linux operating system, for Windows we will also use the command-line interface. Open the the command-line tool and type in the following line to install
skimageon Windows:
pip install scikit-imageIn this section, we will walk through some basic operations that can be performed using the scikit-image library:
- Reading an image: As you know, reading an image is the most fundamental operation you would like to perform. In scikit-image, the image can be read using the
imread()function in the io module of the library. It returns an ndarray. An ndarray in Python is an N dimensional array. The following is an example:
        >>> from skimage import io
        >>> img = io.imread("image.png")
        >>> io.imshow("image.png")
>>> io.show()- Writing/saving an image: To save or write an image we can use the
imsave()function. It takes the absolute or relative path of the file where you want to save the image and the image variable as input:
        >>> from skimage import io
        >>> img = io.imread("image.png")
>>> io.imsave(“new_image.png”, img)- Data module: This module provides some standard test images which one can work on like a grayscale camera image, grayscale text image, coffee cup, and so on. These images can be used as great examples to demonstrate some of the algorithms in image processing.
For example, in the following code,
skimage.data.camera()returns an image array:
       >>> from skimage import data
       >>> io.imshow(data.camera())
       >>> io.show()
The following image is the output of the code; that is, the image returned by skimage.data.camera():
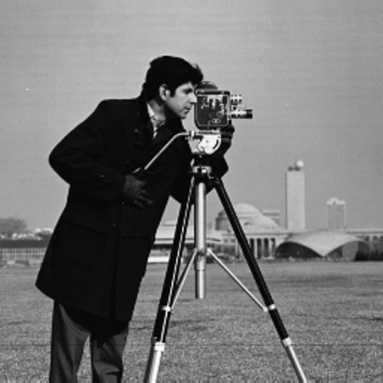
Figure 11: Image returned by the camera() function
Similar to the camera image, we have another image provided by scikit-image. skimage.data.text() returns an image which has handwritten text in it:
>>> from skimage import data
>>> io.imshow(data.text())
>>> io.show()
The following image is the image returned by skimage.data.text():
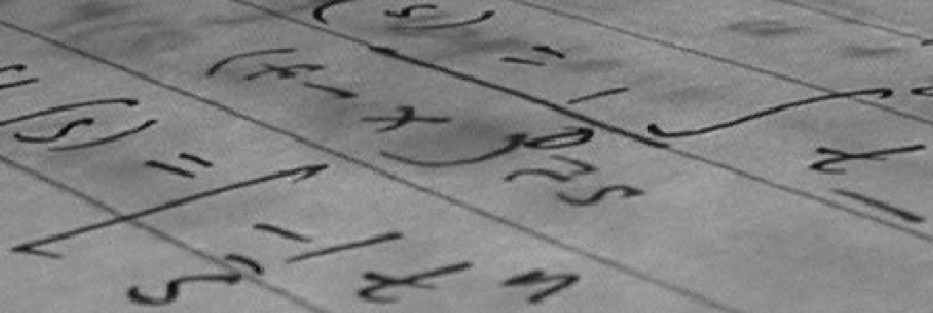
Figure 12:Image returned by the text() function and it can used as an example for corner detection
- Color module: This module of the library contains functions for converting the image from one color space to another. Two such functions are shown as follows:
- Convert RGB to gray: The
rgb2gray()function in the module can be used to convert a RGB image to a grayscale image. It takes the RGB image array as input and returns the grayscale image array.The following code snippet is an example:
- Convert RGB to gray: The
        >>> from skimage import io, color
        >>> img = io.imread("image.png")
        >>> gray = color.rgb2gray(img)
        >>> io.imshow(gray)
        >>> io.show()
The following figure is the output of the code:
Figure 13: Example of a grayscale image
- Convert RGB to HSV: The
rgb2hsv()function in the module can be used to convert an RGB image to an HSV image. It takes the RGB image array as input and returns the HSV image array. The following code shows how to convert RGB to HSV:
- Convert RGB to HSV: The
             >>> from skimage import data
             >>> img = data.astronaut()
             >>> img_hsv = color.rgb2hsv(img)
Note
There are other functions which can be seen at http://scikit-image.org/docs/dev/api/skimage.color.html#module-skimage.color
- Draw module: The draw module has various functions to draw different shapes such as circles, ellipses, and polygons. Let's look at each of them one by one:
- Circles: To draw a circle on an image,
skimageprovides acircle()function. It takes the center coordinates and the radius as input and returns all the pixel coordinates, which lie within the circle of the given coordinates and radius. After getting the pixels within the circle, assign them the value 1 in the 2D matrix and all the other points make it 0.
- Circles: To draw a circle on an image,
            >>> import numpy as np
            >>> from skimage import io, draw
            >>> img = np.zeros((100, 100), dtype=np.uint8)
            >>> x , y = draw.circle(50, 50, 10)
            >>> img[x, y] = 1
            >>> io.imshow(img)
            >>> io.show(
The preceding code snippet would give you a circle as shown here:
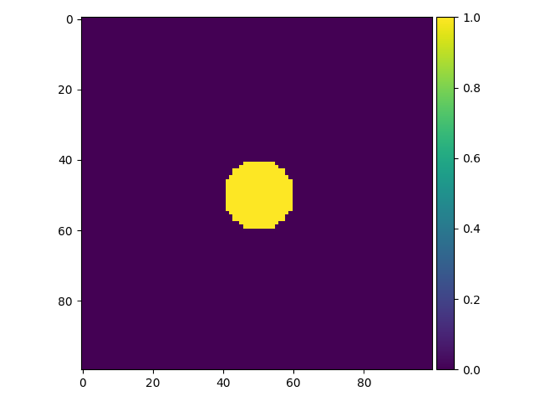
Figure 14: Circle of radius 10 and Centre (50, 50)
- Ellipses: To draw an ellipse on an image,
skimageprovides anellipse()function. This function of the draw module can be used to get the coordinates of the pixels within the ellipse of given parameters. Then, these pixels can be distinguished from others by increasing the pixel value:
- Ellipses: To draw an ellipse on an image,
            >>> import numpy as np
            >>> from skimage import io, draw
            >>> img = np.zeros((100, 100), dtype=np.uint8)
            >>> x , y = draw.ellipse(50, 50, 10, 20)
            >>> img[x, y] = 1
            >>> io.imshow(img)
            >>> io.show()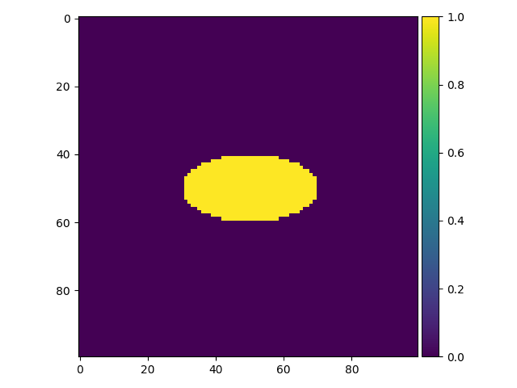
Figure 15: A circle
- Polygons: The
polygon()function takes the array of x and y coordinates of the vertices and returns the pixel coordinates which lie within the polygon:
- Polygons: The
            >>> import numpy as np
            >>> from skimage import io, draw
            >>> img = np.zeros((100, 100), dtype=np.uint8)
            >>> r = np.array([10, 25, 80, 50])
            >>> c = np.array([10, 60, 40, 10])
            >>> x, y = draw.polygon(r, c)
            >>> img[x, y] = 1
            >>> io.imshow(img)
            >>> io.show()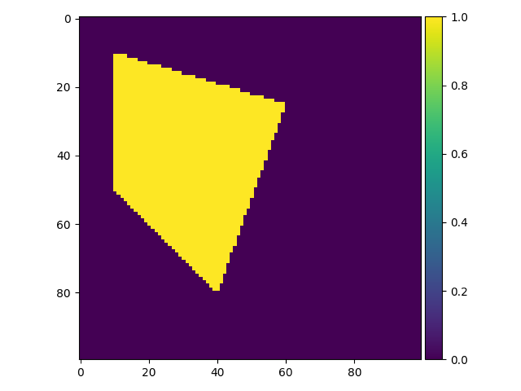
Figure 16: A polygon
A point worth noting in this section is that the (0, 0) point is not at the bottom left of the image but at the top right of the image. This is a standard convention followed in Computer Vision.