
As mentioned before, regression analysis is a statistical process for studying the relationship between a set of independent variables (explanatory variables) and the dependent variable (response variable). Through this technique, it will be possible to understand how the value of the response variable changes when the explanatory variable is varied.
The power of regression techniques is due to the quality of their algorithms, which have been improved and updated over the years. These are divided into several main types, depending on the nature of the dependent and independent variables used or the shape of the regression line.
The reason for such a wide range of regression techniques is the variety of cases to be analyzed. Each case is based on data with specific characteristics, and each analysis is characterized by specific objectives. These specifications require the use of different types of regression techniques to obtain the best results.
How do we distinguish between different types of regression techniques? Previously, we said that a first distinction can be made based on the form of the regression line. Based on this feature, the regression analysis is divided into linear regression and nonlinear regression, as shown in the following figure (linear regression to the left and nonlinear quadratic regression to the right):
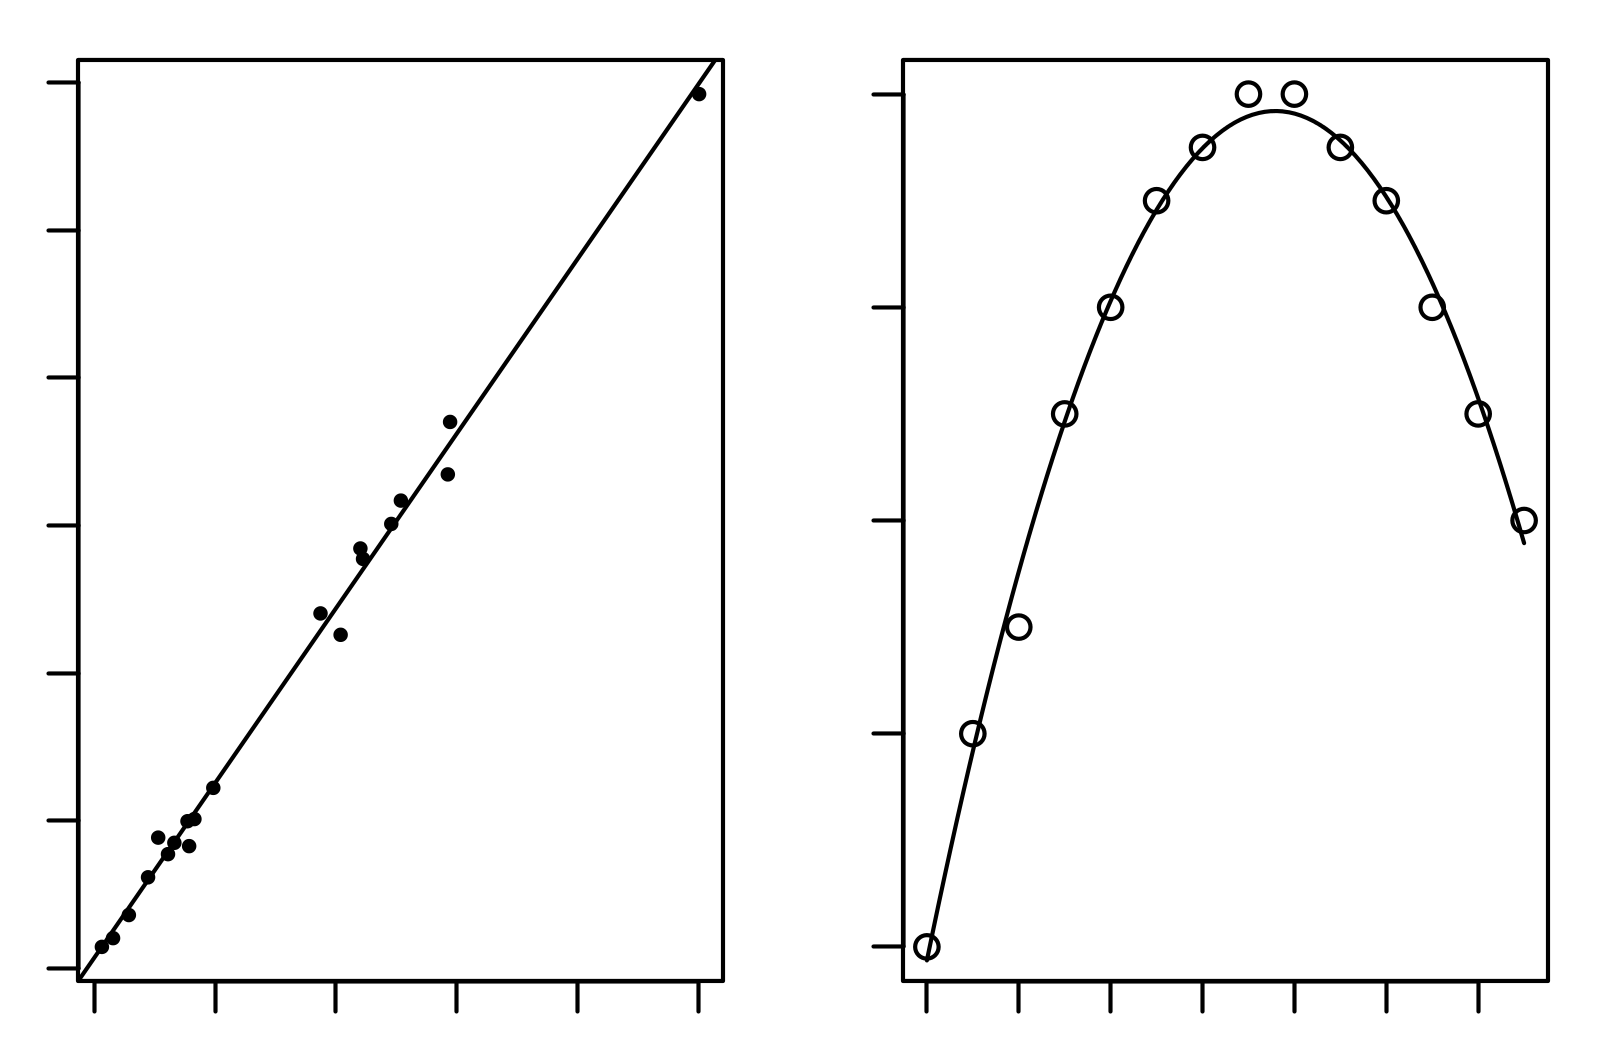
It's clear that the shape of the regression line is dependent on the distribution of data. There are cases where a straight line is the regression line that best approximates the data, while in other cases, you need to fall into a curve to get the best approximation. That said, it is easy to understand that a visual analysis of the distribution of data we are going to analyze is a good practice to be done in advance. By summarizing the shape of distribution, we can distinguish the type of regression between the following:
- Linear regression
- Nonlinear regression
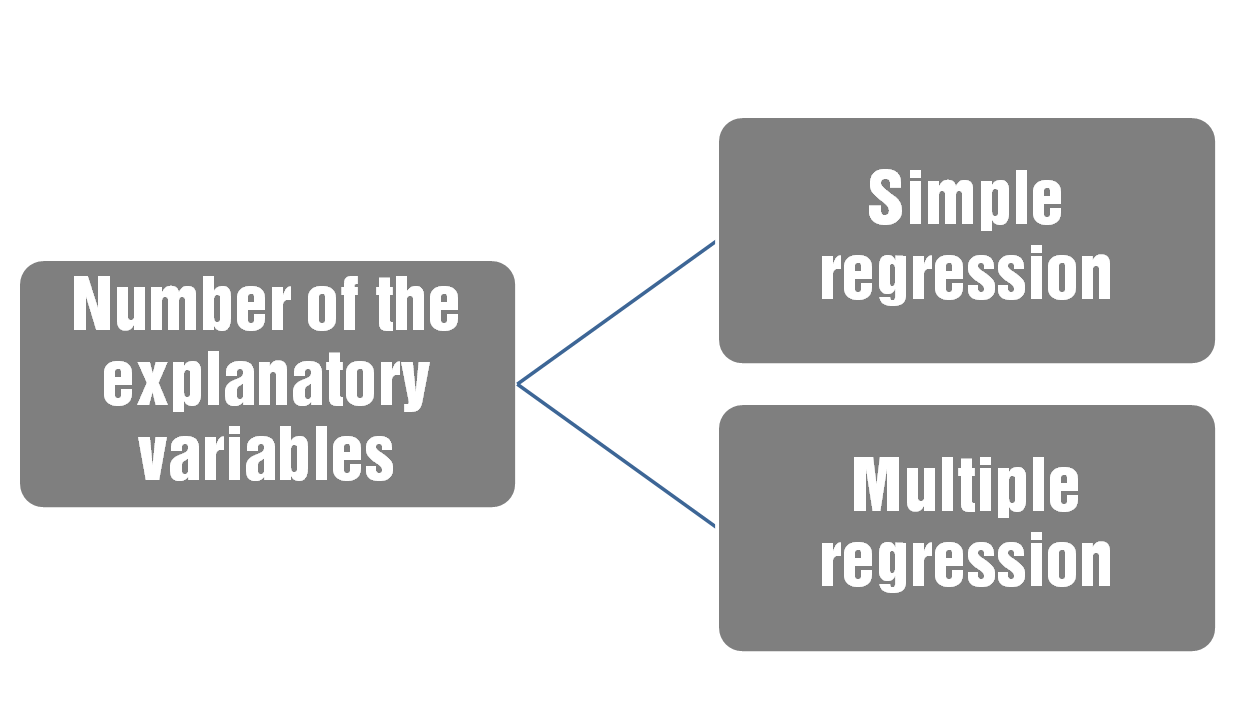
Let us now analyze the nature of the variables involved. In this regard, a question arises spontaneously: can the number of explanatory variables affect the choice of regression technique? The answer to this question is surely positive. For example, in the case of linear regression, if there is only one input variable, then we will do simple linear regression. If, instead, the input variables are two or more, we will need to perform multiple linear regression.
By summarizing, a simple linear regression shows the relationship between a dependent variable Y and an independent variable X. A multiple regression model shows the relationship between a dependent variable Y and multiple independent variables X. In the following figure, the types of regression imposed from the Number of the explanatory variables are shown:
What if we have multiple response variables rather than explanatory variables? In that case, we move from univariate models to multivariate models. As suggested by the name itself, multivariate regression is a technique with the help of which a single regression model can be estimated with more than one response variable. When there is more than one explanatory variable in a multivariate regression model, the model is a multivariate multiple regression.
Finally, let's see what happens when we analyze the type of variables. Usually, regression analysis is used when you want to predict a continuous response variable from a number of explanatory variables, also continuous. But this is not a limitation of regression, in the sense that such analysis is also applicable when categorical variables are at stake.
In the case of a dichotomous explanatory variable (which takes a value of zero or one), the solution is immediate. There are already two numbers (zero and one) associated to this variable, so the regression is immediately applicable. Categorical explanatory variables with more than two values can also be used in regression analyses; however, before they can be used, they need to be converted into variables that have only two levels (such as zero and one). This is called dummy coding or indicator variables.
Logistic regression should be used if the response variable is dichotomous.