Book Image

Learning Jupyter 5 - Second Edition

Book Image

Learning Jupyter 5 - Second Edition

Overview of this book

The Jupyter Notebook allows you to create and share documents that contain live code, equations, visualizations, and explanatory text. The Jupyter Notebook system is extensively used in domains such as data cleaning and transformation, numerical simulation, statistical modeling, and machine learning. Learning Jupyter 5 will help you get to grips with interactive computing using real-world examples. The book starts with a detailed overview of the Jupyter Notebook system and its installation in different environments. Next, you will learn to integrate the Jupyter system with different programming languages such as R, Python, Java, JavaScript, and Julia, and explore various versions and packages that are compatible with the Notebook system. Moving ahead, you will master interactive widgets and namespaces and work with Jupyter in a multi-user mode. By the end of this book, you will have used Jupyter with a big dataset and be able to apply all the functionalities you’ve explored throughout the book. You will also have learned all about the Jupyter Notebook and be able to start performing data transformation, numerical simulation, and data visualization.
Table of Contents (18 chapters)
Title Page
Packt Upsell
Contributors
Preface
Index

Julia Vega plotting


Another popular graphics package is Vega. The main feature of Vega is the ability to describe your graphic by using language primitives such as JSON. Vega produces most of the standard plots. Here is an example script using Vega for a pie chart:

Pkg.add("Vega") 
using Vega 
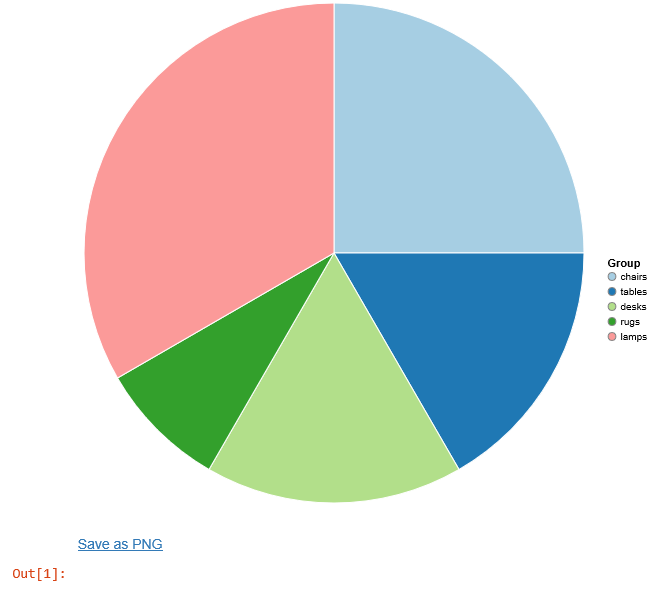
stock = ["chairs", "tables", "desks", "rugs", "lamps"]; 
quantity = [15, 10, 10, 5, 20]; 
piechart(x = stock, y = quantity) 

The resultant output in Jupyter may look like the following screenshot:

Note

Note the INFO: Precompiling module Vega. package. Even though the package had been loaded as part of the install or update process, it still needed to adjust the library on first use.

The generated graphic produced under Jupyter is shown in the following screenshot

Vega gives you the option on the resultant display to Save as PNG. I think this is a useful feature, allowing you to embed the generated graphic(s) in another document:


Julia PyPlot plotting

Another plotting package available is PyPlot. PyPlot is...