Book Image

Hands-On Unsupervised Learning with Python

By : Giuseppe Bonaccorso
Book Image

Hands-On Unsupervised Learning with Python

By: Giuseppe Bonaccorso

Overview of this book

Unsupervised learning is about making use of raw, untagged data and applying learning algorithms to it to help a machine predict its outcome. With this book, you will explore the concept of unsupervised learning to cluster large sets of data and analyze them repeatedly until the desired outcome is found using Python. This book starts with the key differences between supervised, unsupervised, and semi-supervised learning. You will be introduced to the best-used libraries and frameworks from the Python ecosystem and address unsupervised learning in both the machine learning and deep learning domains. You will explore various algorithms, techniques that are used to implement unsupervised learning in real-world use cases. You will learn a variety of unsupervised learning approaches, including randomized optimization, clustering, feature selection and transformation, and information theory. You will get hands-on experience with how neural networks can be employed in unsupervised scenarios. You will also explore the steps involved in building and training a GAN in order to process images. By the end of this book, you will have learned the art of unsupervised learning for different real-world challenges.
Table of Contents (12 chapters)

Types of machine learning algorithm

At this point, we can briefly introduce the different types of machine learning, focusing on their main peculiarities and differences. In the following sections, we'll discuss informal definitions followed by more formal ones. If you are not familiar with the mathematical concepts involved in the discussion, you can skip the details. However, it's highly advisable to study all unknown theoretical elements, as they are fundamental to understanding the concepts analyzed in the next chapters.

Supervised learning algorithms

In a supervised scenario, the task of the model is to find the correct label of a sample, assuming that the presence of a training set is correctly labeled, along with the possibility of comparing the estimated value with the correct one. The term supervised is derived from the idea of an external teaching agent that provides precise and immediate feedback after each prediction. The model can use such feedback as a measure of the error and, consequently perform the corrections needed to reduce it.

More formally, if we assume a data generating process, the dataset is obtained as:

As discussed in the previous section, all samples must be independent and identically distributed (IID) values uniformly sampled from the data generating process. In particular, all classes must represent the actual distribution (for example, if p(y=0) = 0.4 and p(y=1) = 0.6, the proportion should 40% or 60%). However, in order to avoid biases, when the discrepancies between classes are not very large, a reasonable choice is a perfectly uniform sampling and has the same number of representatives for y=1, 2, ..., M.

A generic classifier can be modeled in two ways:

  • A parametrized function that outputs the predicted class
  • A parametrized probability distribution that outputs the class probability for every input sample

In the first case, we have:

Considering the whole dataset X, it's possible to compute a global cost function L:

As L depends only on the parameter vector (xi and yi are constants), a generic algorithm must find the optimal parameter vector that minimizes the cost function. For example, in a regression problem (where the labels are continuous), the error measure can be the squared error between the actual value and prediction:

Such a cost function can be optimized in different ways (peculiar to specific algorithms), but a very common strategy (above all in deep learning) is to employ the Stochastic Gradient Descent (SGD) algorithm. It consists of an iteration of the following two steps:

  • Computing the gradient ∇L (with respect to the parameter vector) with a small batch of samples xi ∈ X
  • Updating the weights and moving the parameters in the opposite direction of the gradient -∇L (remember that the gradient is always directed towards a maximum)

Instead, when the classifier is probabilistic, it should be represented as a parametrized conditional probability distribution:

In other words, the classifier will now output the probability of a label y given an input vector. The goal is now to find the optimal parameter set, which will obtain:

In the preceding formula, we have expressed pdata as a conditional distribution. The optimization can be obtained using a probabilistic distance metric, such as the Kullback-Leibler divergence DKL (which is always non-negative DKL 0 and DKL = 0 only when the two distributions are identical):

With a few simple manipulations, we obtain:

Therefore, the resulting cost function corresponds to the difference between the cross-entropy between p and pdata up to a constant value (the entropy of the data generating process). Therefore, the training strategy is now based on representing labels using one-hot encoding (for example, if there are two labels 0 → (0, 1) and 1 → (1, 0), so that the sum of all elements must be always equal to 1) and using an intrinsic probabilistic output (such as in a logistic regression) or a softmax filter, which transforms M values into a probability distribution.

In both cases, it's clear the presence of a hidden teacher provides a consistent measure of the error, allowing the model to correct the parameters accordingly. In particular, the second approach is extremely helpful for our purposes, therefore I recommend studying it further if it's not known well (all the main definitions can also be found in Bonaccorso G., Machine Learning Algorithms, Second Edition, Packt, 2018).

We can now discuss a very basic example of supervised learning, a linear regression model that can be employed to predict the evolution of a simple time series.

Supervised hello world!

In this example, we want to show how to perform a simple linear regression with bidimensional data. In particular, let's assume that we have a custom dataset containing 100 samples, as follows:

import numpy as np
import pandas as pd

T = np.expand_dims(np.linspace(0.0, 10.0, num=100), axis=1)
X = (T * np.random.uniform(1.0, 1.5, size=(100, 1))) + np.random.normal(0.0, 3.5, size=(100, 1))
df = pd.DataFrame(np.concatenate([T, X], axis=1), columns=['t', 'x'])
We have also created a pandas DataFrame because it's easier to create plots using the seaborn library (https://seaborn.pydata.org). In the book, the code for the plots (using Matplotlib or seaborn) is normally omitted, but it's always present in the repository.

We want to express the dataset in a synthetic way, as follows:

This task can be carried out using a linear regression algorithm, as follows:

from sklearn.linear_model import LinearRegression

lr = LinearRegression()
lr.fit(T, X)

print('x(t) = {0:.3f}t + {1:.3f}'.format(lr.coef_[0][0], lr.intercept_[0]))

The output of the last command is the following:

x(t) = 1.169t + 0.628

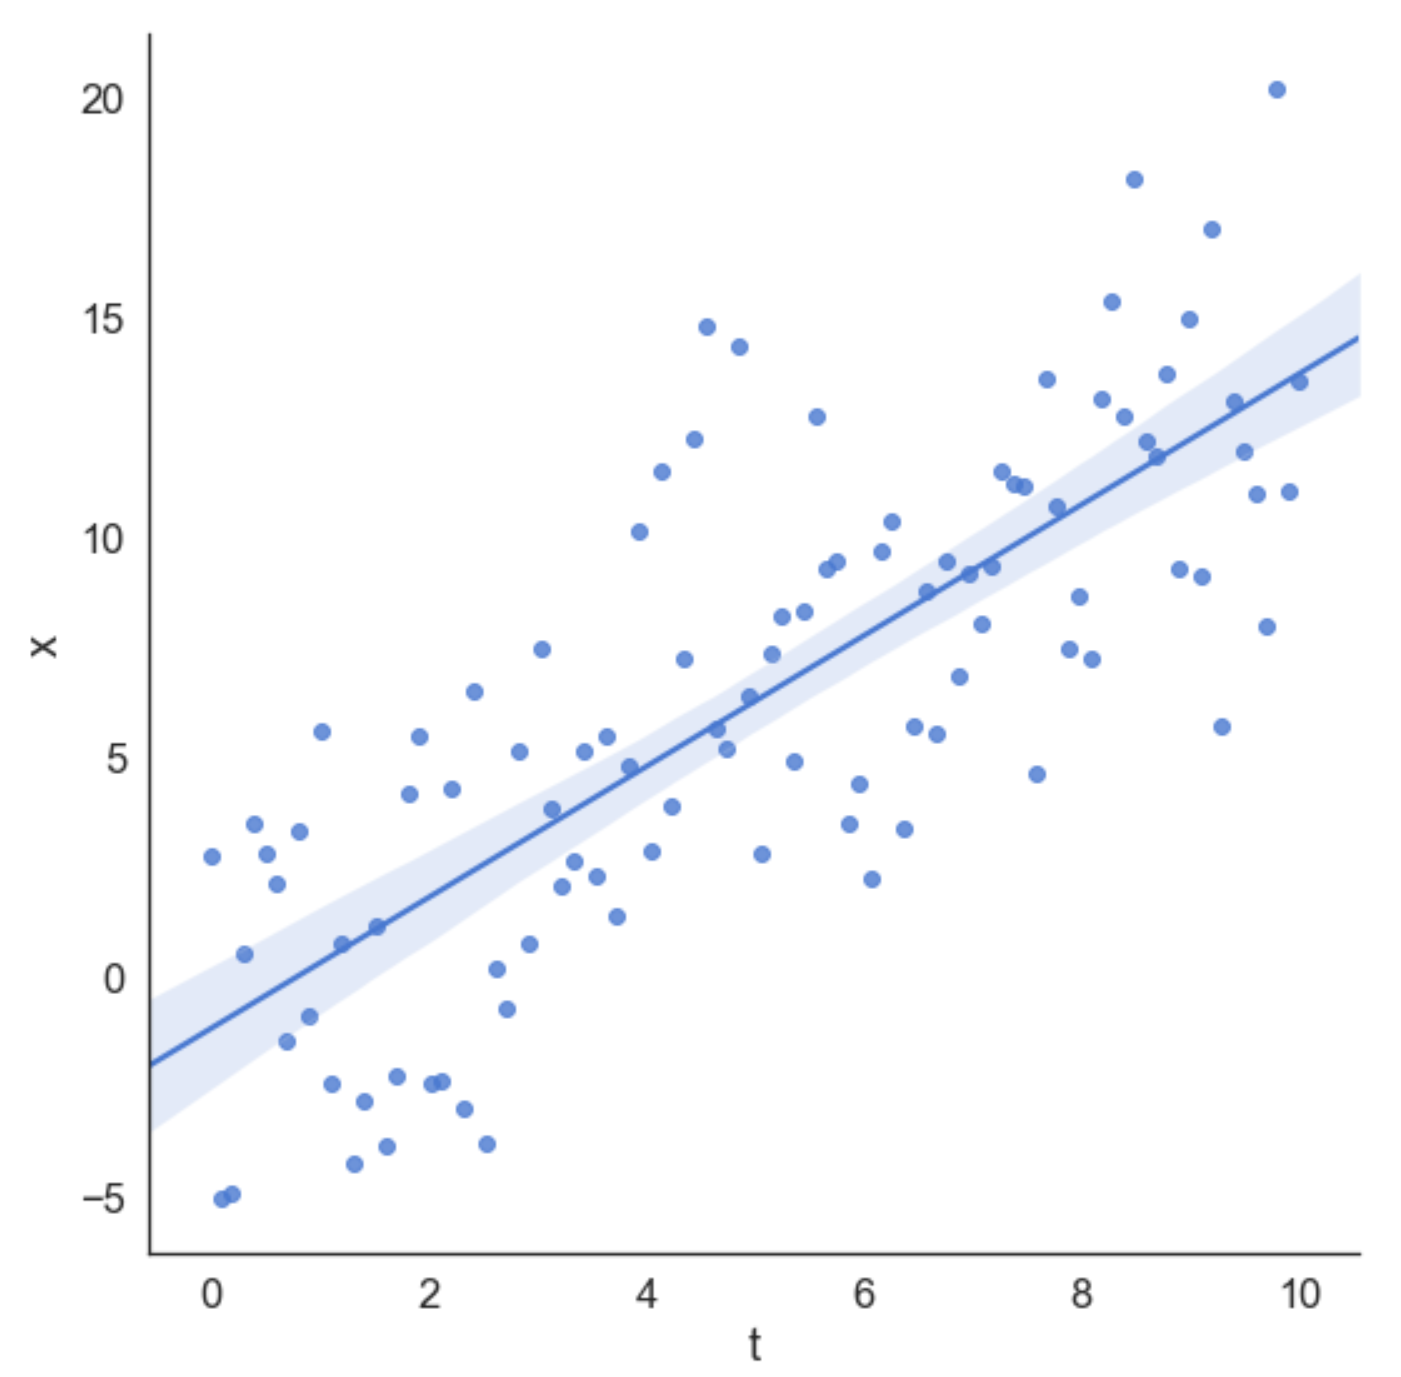
We can also get visual confirmation, drawing the dataset together with the regression line, as shown in the following graph:

Dataset and regression line

In this example, the regression algorithm minimized a squared error cost function, trying to reduce the discrepancy between the predicted value and the actual one. The presence of Gaussian (with null mean) noise has a minimum impact on the slope, thanks to the symmetric distribution.

Unsupervised learning algorithms

In an unsupervised scenario, as it's easy to imagine, there is no hidden teacher, hence the main goals cannot be related to minimizing the prediction error with respect to the ground truth. Indeed, the same concept of ground truth has a slightly different meaning in this context. In fact, when working with classifiers, we want to have a null error for the training samples (meaning that other classes than the true ones are never accepted as correct).

Conversely, in an unsupervised problem, we want the model to learn some pieces of information without any formal indication. This condition implies that the only elements that can be learned are the ones contained in the samples themselves. Therefore, an unsupervised algorithm is usually aimed at discovering the similarities and patterns among samples or reproducing an input distribution given a set of vectors drawn from it. Let's now analyze some of the most common categories of unsupervised models.

Cluster analysis

Cluster analysis (normally called just clustering) is an example of a task where we want to find out common features among large sets of samples. In this case, we always suppose the existence of a data generating process and we define the dataset X as:

A clustering algorithm is based on the implicit assumption that samples can be grouped according to their similarities. In particular, given two vectors, a similarity function is defined as the reciprocal or inverse of a metric function. For example, if we are working in a Euclidean space, we have:

In the previous formula, the constant ε has been introduced to avoid division by zero. It's obvious that d(a, c) < d(a, b) ⇒ s(a, c) > s(a, b). Therefore, given a representative of each cluster , we can create the set of assigned vectors considering the rule:

In other words, a cluster contains all those elements whose distance from the representative is minimum compared to all other representatives. This implies that a cluster contains samples whose similarity with the representative is maximal compared to all representatives. Moreover, after the assignment, a sample gains the right to share its feature with the other members of the same cluster.

In fact, one of the most important applications of cluster analysis is trying to increase the homogeneity of samples that are recognized as similar. For example, a recommendation engine could be based on the clustering of the user vectors (containing information about their interests and bought products). Once the groups have been defined, all the elements belonging to the same cluster are considered as similar, hence we are implicitly authorized to share the differences. If user A has bought the product P and rated it positively, we can suggest this item to user B who didn't buy it and the other way around. The process can appear arbitrary, but it turns out to be extremely effective when the number of elements is large and the feature vectors contain many discriminative elements (for example, ratings).

Generative models

Another unsupervised approach is based on generative models. The concept is not very different from what we have already discussed for supervised algorithms, but, in this case, the data generating process doesn't contain any label. Hence the goal is to model a parametrized distribution and optimize the parameters so that the distance between candidate distribution and the data generating process is minimized:

The process is generally based on the Kullback-Leibler divergence or other similar measures:

At the end of the training phase, we assume L → 0, so p ≈ pdata. In this way, we have not limited the analysis to a subset of possible samples, but rather to the entire distribution. Using a generative model allows you to draw new samples that can be very different from the ones selected for the training process, but they always belong to the same distribution. Therefore, they are (potentially) always acceptable.

For example, a Generative Adversarial Network (GAN) is a particular deep learning model that is able to learn the distribution of an image set, producing new samples that are almost indistinguishable (from a visual semantic point of view) from the training ones. As unsupervised learning is the main topic of this book, we won't dwell further on GAN in this introduction. All these concepts will be extensively discussed (with practical examples) in all the next chapters.

Association rules

The last unsupervised approach we're considering is based on the discovery of association rules and it's extremely important in the field of data mining. A common scenario is represented by a collection of commercial transactions made up of a subset of products. The goal is to find out the most important associations between products (for example, the probability of buying Pi and Pj is 70%). Specific algorithms can efficiently mine a whole database, highlighting all the relationships that can be taken into account for strategic and logistic purposes. For example, an online store can employ this method to promote all those items that are frequently bought together with other ones. Moreover, a predictive approach allows simplifying the provisioning processes by suggesting all those products that are very likely to be sold out, thanks to an increase in the sales of other items.

At this point, it's helpful to introduce the reader to a practical example of unsupervised learning. No particular prerequisites are needed, but it's preferable to have a basic knowledge of probability theory.

Unsupervised hello world!

As this book is completely dedicated to unsupervised algorithms, I've decided not to show a simple cluster analysis as a hello world! example, but rather a quite basic generative model. Let's assume that we are monitoring the number of trains that arrive at a subway station every hour because we need to ascertain the number of security agents required at the station. In particular, we're asked to have at least one agent per train and whenever there are fewer, we're going to pay a fine.

Moreover, it's easier to send a group at the beginning of every hour instead of controlling the agents one by one. As the problem is very simple, we also know that a good distribution is the Poisson one, parameterized with μ, which is also the mean. From the theory, we know that such a distribution can effectively model the random number of events happening in a fixed time frame, under the main assumption of independence. In general cases, a generative model is based on a parameterized distribution (for example, with a neural network) and no specific assumptions are made about its family. Only in some particular cases (for example, Gaussian mixture), is it reasonable to pick distributions with particular properties and, without loss of rigor, we can consider this example as one such scenario.

The probability mass function of a Poisson distribution is:

This distribution describes the probability of observing k events in a predefined interval. In our case, the interval is always one hour and we're keen to estimate the probability of observing more than 10 trains. How can we obtain the correct figure for μ?

The most common strategy is called Maximum Likelihood Estimation (MLE). It collects a set of observations and finds the value of μ that maximizes the probability that all the points have been generated by our distribution.

Assuming we have collected N observations (each observation is the number of arrivals in one hour), the likelihood of μ with respect to all samples is the joint probability of all samples (for simplicity, assumed to be IID) under the probability distribution computed using μ:

As we are working with a product and exponential, it's a common rule to compute the log-likelihood:

Once the log-likelihood has been computed, it's possible to set the derivative with respect to μ equal to 0 in order to find the optimal value. In this case, we omit the proof (which is straightforward to obtain) and arrive directly at the MLE estimation of μ:

We are lucky! The MLE estimation is just the average of the arrival times. This means that, if we have observed N values with average μ, the Poisson distribution, which is the most likely to have generated them, has μ as the characteristic coefficient. Therefore, any other sample drawn from such a distribution will be compatible with the observed dataset.

We can now start with our first simulation. Let's assume we've collected 25 observations during the early afternoon of a business day, as follows:

import numpy as np

obs = np.array([7, 11, 9, 9, 8, 11, 9, 9, 8, 7, 11, 8, 9, 9, 11, 7, 10, 9, 10, 9, 7, 8, 9, 10, 13])
mu = np.mean(obs)

print('mu = {}'.format(mu))

The output of the last command is as follows:

mu = 9.12

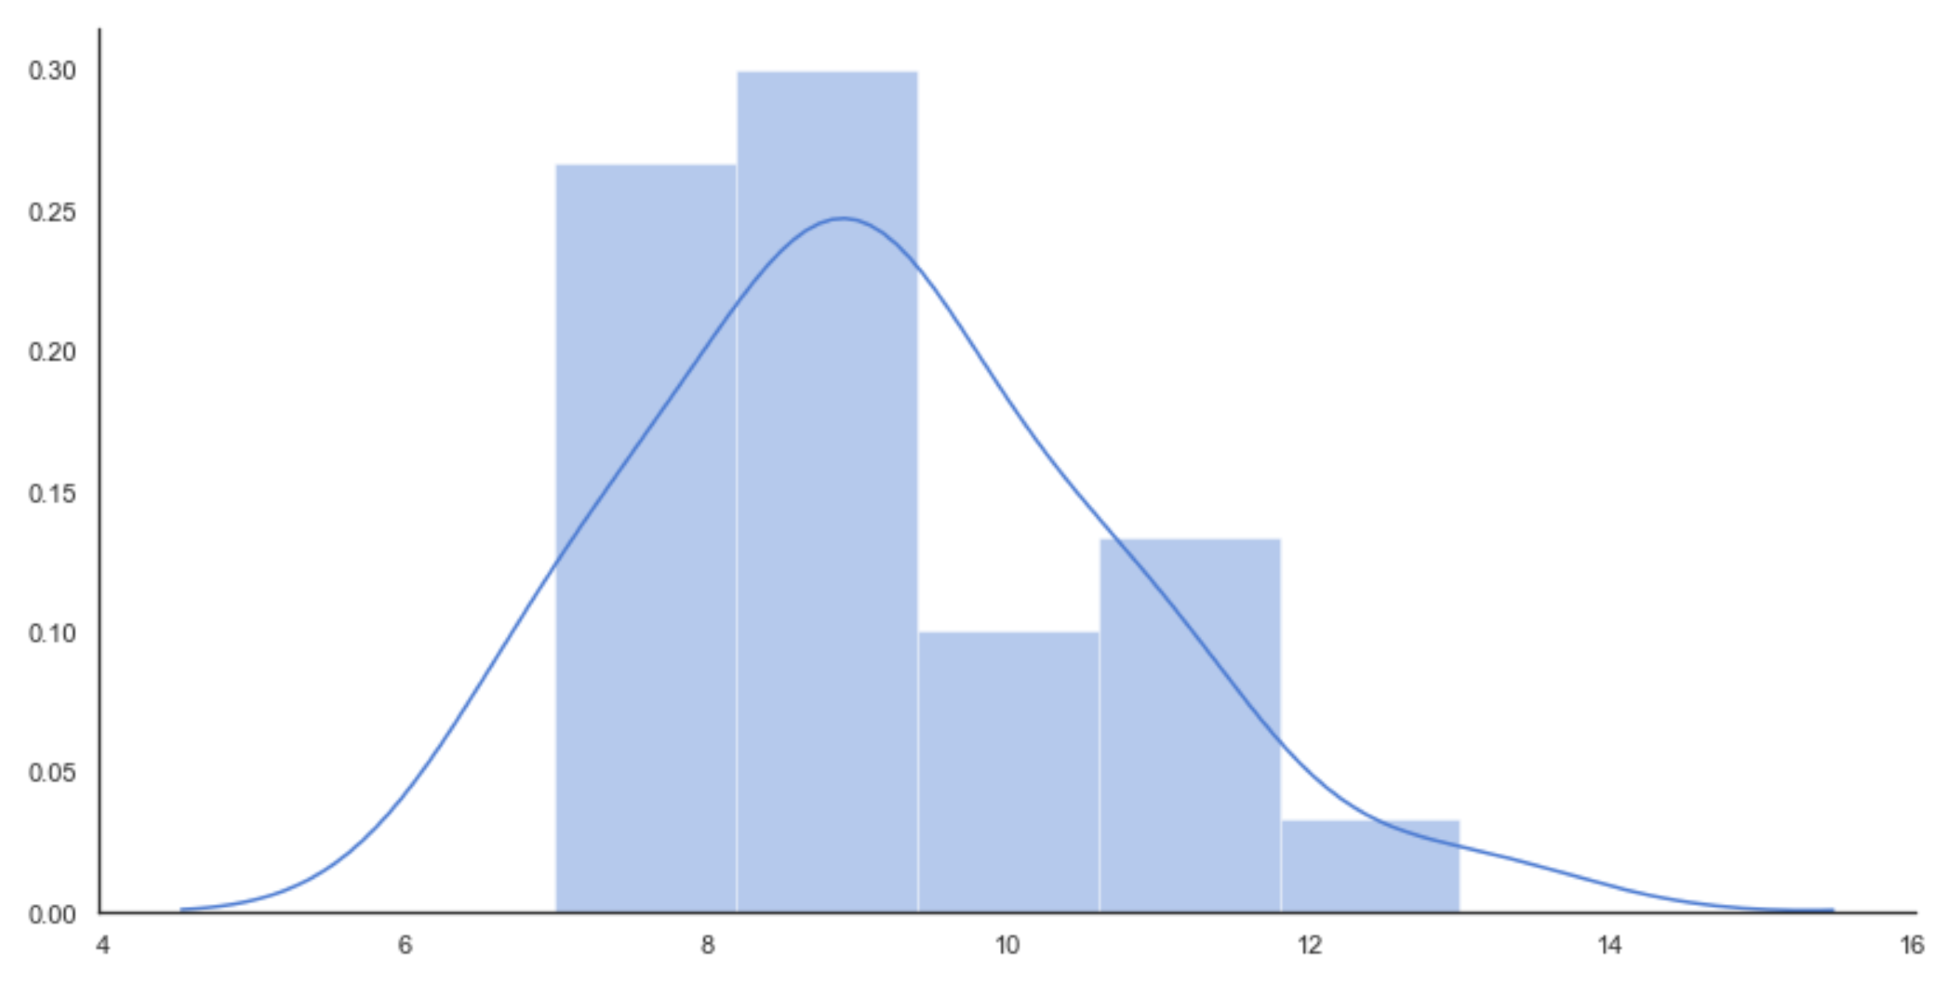
Hence, we have an arrival average of about nine trains per hour. The histogram is shown in the following diagram:

Histogram of the initial distribution

To compute the requested probabilities, we need to work with the Cumulative Distribution Function (CDF), which is implemented in SciPy (in the scipy.stats package). In particular, as we are interested in the probability of observing more trains than a fixed value, it's necessary to use the Survival Function (SF), which corresponds to 1-CDF, as follows:

from scipy.stats import poisson

print('P(more than 8 trains) = {}'.format(poisson.sf(8, mu)))
print('P(more than 9 trains) = {}'.format(poisson.sf(9, mu)))
print('P(more than 10 trains) = {}'.format(poisson.sf(10, mu)))
print('P(more than 11 trains) = {}'.format(poisson.sf(11, mu)))

The output of the preceding snippet is as follows:

P(more than 8 trains) = 0.5600494497386543
P(more than 9 trains) = 0.42839824517059516
P(more than 10 trains) = 0.30833234660452563
P(more than 11 trains) = 0.20878680161156604

As expected, the probability of observing more than 10 trains is low (30%) and it doesn't seem reasonable to send 10 agents. However, as our model is adaptive, we can continue collecting observations (for example, during the early morning), as follows:

new_obs = np.array([13, 14, 11, 10, 11, 13, 13, 9, 11, 14, 12, 11, 12, 14, 8, 13, 10, 14, 12, 13, 10, 9, 14, 13, 11, 14, 13, 14])

obs = np.concatenate([obs, new_obs])
mu = np.mean(obs)

print('mu = {}'.format(mu))

The new value for μ is as follows:

mu = 10.641509433962264

Now the average is almost 11 trains per hour. Assuming that we have collected enough samples (considering all potential accidents), we can re-estimate the probabilities, as follows:

print('P(more than 8 trains) = {}'.format(poisson.sf(8, mu)))
print('P(more than 9 trains) = {}'.format(poisson.sf(9, mu)))
print('P(more than 10 trains) = {}'.format(poisson.sf(10, mu)))
print('P(more than 11 trains) = {}'.format(poisson.sf(11, mu)))

The output is as follows:

P(more than 8 trains) = 0.7346243910180037
P(more than 9 trains) = 0.6193541369812121
P(more than 10 trains) = 0.49668918740243756
P(more than 11 trains) = 0.3780218948425254

With the new dataset, the probability of observing more than nine trains is about 62%, (which confirms our initial choice), but the probability of observing more than 10 trains is now about 50%. As we don't want to risk paying the fine (which is higher than the cost of an agent), it's always better to send a group of 10 agents. In order to get further confirmation, we have decided to sample 2,000 values from the distribution, as follows:

syn = poisson.rvs(mu, size=2000)

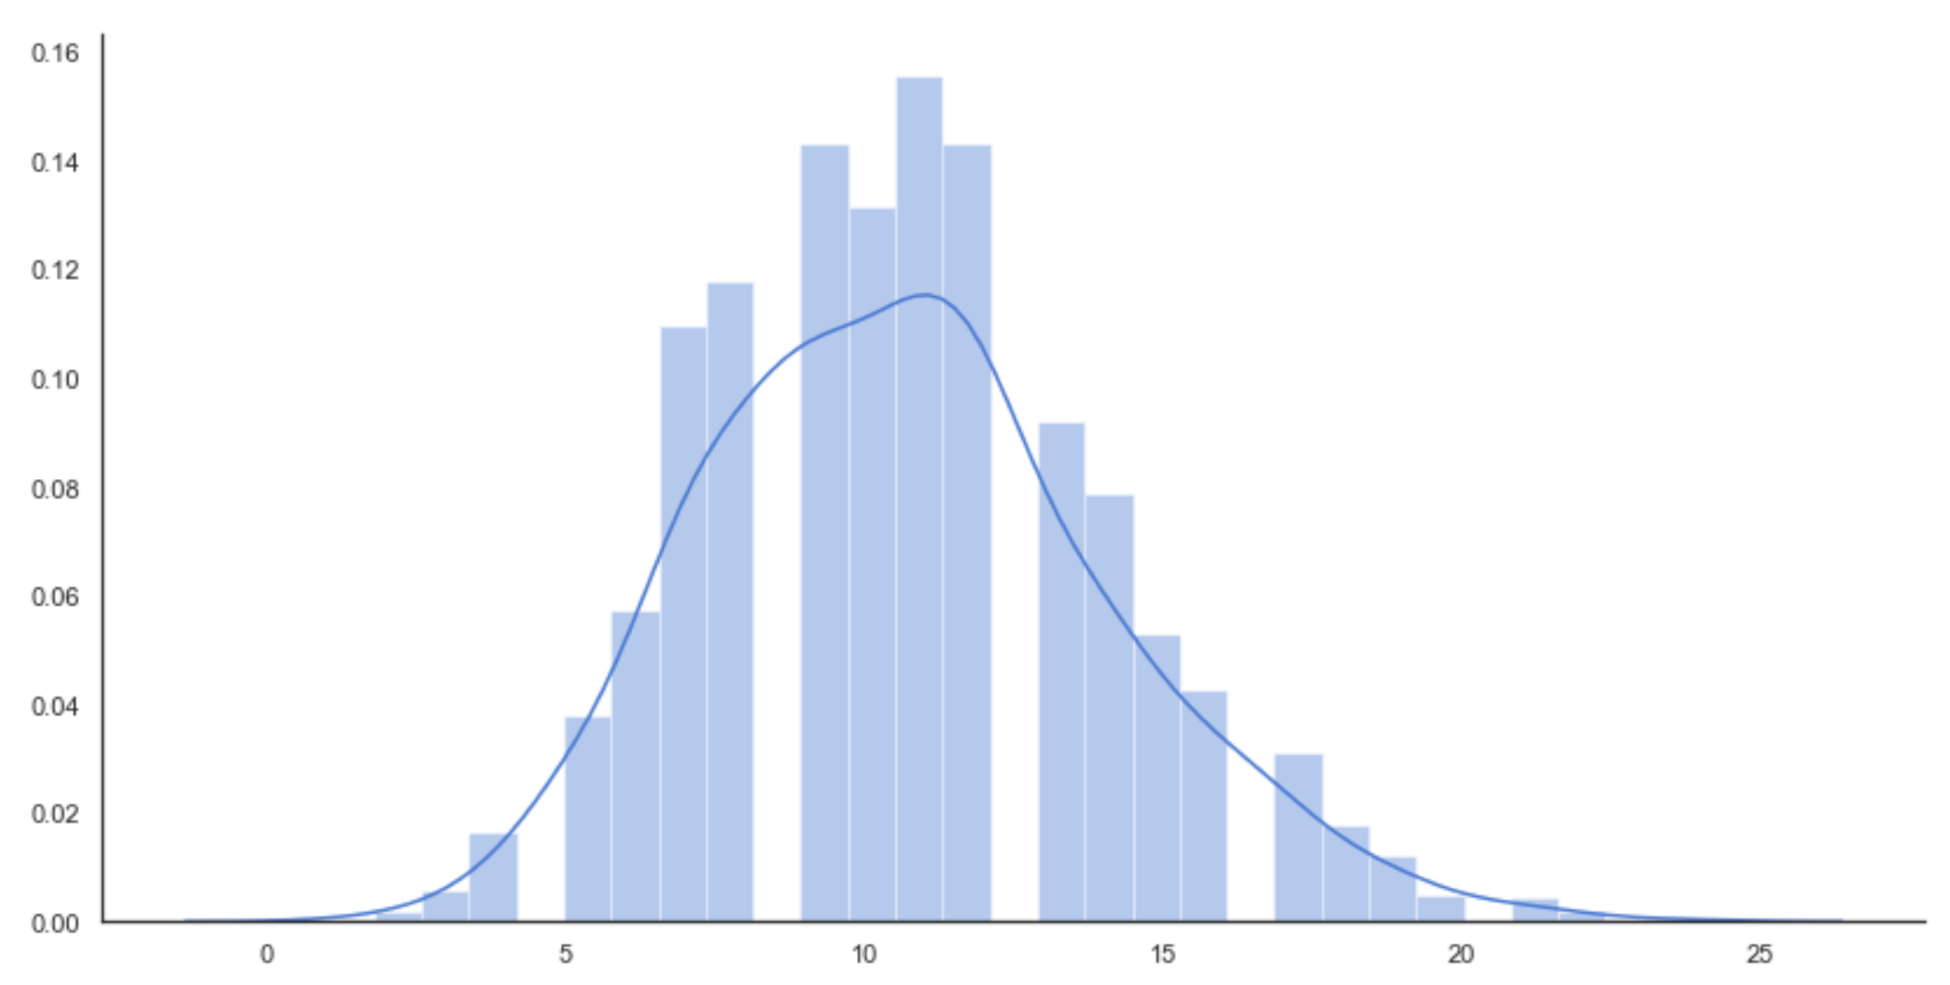
The corresponding histogram is shown in the following diagram:

Histogram of 2000 points sampled from the final Poisson distribution

The diagram confirms a peak slightly after 10 (very close to 11) and a rapid decay starting from k = 13, which has already been discovered using a limited dataset (compare the shapes of the histograms for further confirmation). However, in this case, we are generating potential samples that couldn't be present in our observation set. The MLE guarantees that the probability distribution is consistent with the data and that the new samples are weighted accordingly. This example is clearly extremely simple and its goal was only to show the dynamics of a generative model.

We are going to discuss many other more complex models and examples in the next chapters of the book. One important technique, common to many algorithms lies in not picking a predefined distribution (which implies an apriori knowledge) but rather in using flexible parametric models (for example, neural networks) to find out the optimal distribution. The choice of a predefined prior (as in this case) is justified only when there's a high confidence degree about the underlying stochastic process. In all other situations, it's always preferable to avoid any assumption and rely only on the data in order to find the most appropriate approximation of the data generating process.

Semi-supervised learning algorithms

A semi-supervised scenario can be considered as a standard supervised one that exploits some features belonging to unsupervised learning techniques. A very common problem, in fact, arises when it's easy to obtain large unlabeled datasets but the cost of labeling is very high. Hence, it's reasonable to label only a fraction of the samples and to propagate the labels to all unlabeled ones whose distance from a labeled sample is below a predefined threshold. If the dataset has been drawn from a single data generating process and the labeled samples are uniformly distributed, a semi-supervised algorithm can achieve an accuracy comparable with a supervised one. In this book, we are not discussing these algorithms; however, it's helpful to briefly introduce two very important models:

  • Label propagation
  • Semi-supervised Support Vector Machines

The first one is called label propagation and its goal is to propagate the labels of a few samples to a larger population. This goal is achieved by considering a graph where each vertex represents a sample and every edge is weighted using a distance function. Through an iterative procedure, all labeled samples will send a fraction of their label values to all their neighbors and the process is repeated until the labels stop changing. This system has a stable point (that is, a configuration that cannot evolve anymore) and the algorithm can easily reach it with a limited number of iterations.

Label propagation is extremely helpful in all those contexts where some samples can be labeled according to a similarity measure. For example, an online store could have a large base of customers, but only 10% have disclosed their gender. If the feature vectors are rich enough to represent the common behavior of male and female users, it's possible to employ the label propagation algorithm to guess the gender of customers who haven't disclosed it. Of course, it's important to remember that all the assignments are based on the assumption that similar samples have the same label. This can be true in many situations, but it can also be misleading when the complexity of the feature vectors increases.

Another important family of semi-supervised algorithms is based on the extension of standard SVM, (short for Support Vector Machine) to datasets containing unlabeled samples. In this case, we don't want to propagate existing labels, but rather the classification criterion. In other words, we want to train the classifier using the labeled dataset and extend the discriminative rule to the unlabeled samples as well.

Contrary to the standard procedure that can only evaluate unlabeled samples, a semi-supervised SVM uses them to correct the separating hyperplane. The assumption is always based on the similarity: if A has label 1 and the unlabeled sample B has d(A, B) < ε (where ε is a predefined threshold), it's reasonable to assume that the label of B is also 1. In this way, the classifier can achieve high accuracy on the whole dataset even if only a subset has been manually labeled. Similar to label propagation, these kinds of model are reliable only when the structure of the dataset is not extremely complex and, in particular, when the similarity assumption holds (unfortunately there are some cases where it's extremely difficult to find a suitable distance metric, hence many similar samples are indeed dissimilar and vice versa).

Reinforcement learning algorithms

A reinforcement learning scenario can be considered as a supervised one where the hidden teacher provides only approximate feedback after every decision of the model. More formally, reinforcement learning is characterized by continuous interaction between an agent and an environment. The former is responsible for making decisions (actions), finalized to increase its return, while the latter provides feedback to every action. Feedback is generally considered as a reward, whose value can be either positive (the action has been successful) or negative (the action shouldn't be repeated). As the agent analyzes different configurations of the environment (states), every reward must be considered as bound to the tuple (action, state). Hence, the final goal is to find a policy (a strategy that suggests the optimal action in every state) that maximizes the expected total reward.

A very classical example of reinforcement learning is an agent that learns how to play a game. During an episode, the agent tests the actions in all encountered states and collects the rewards. An algorithm corrects the policy to reduce the likelihood of non-positive actions (that is, those whose reward is positive) and increase the expected total rewards obtainable at the end of the episode.

Reinforcement learning has many interesting applications, which are not limited to games. For example, a recommendation system can correct suggestions according to binary feedback (for example, thumb up or down) provided by the user. The main difference between reinforcement and supervised learning is the information provided by the environment. In fact, in a supervised scenario, the correction is normally proportional to it, while in a reinforcement learning one it must be analyzed considering a sequence of actions and future rewards. Therefore, the corrections are normally based on the estimation of the expected reward and their effect is influenced by the value of the subsequent actions. For example, a supervised model has no memory, hence its corrections are immediate, while a reinforcement learning agent must consider the partial rollout of an episode in order to decide whether an action is actually negative or not.

Reinforcement learning is a fascinating branch of machine learning. Unfortunately, this topic is beyond the scope of this work, therefore we are not discussing it in detail (you can find further details in Hands-On Reinforcement Learning with Python, Ravichandiran S., Packt Publishing, 2018 and Mastering Machine Learning Algorithms, Bonaccorso G., Packt Publishing, 2018).

We can now briefly explain why Python has been chosen as the main language for this exploration of the world of unsupervised learning.