


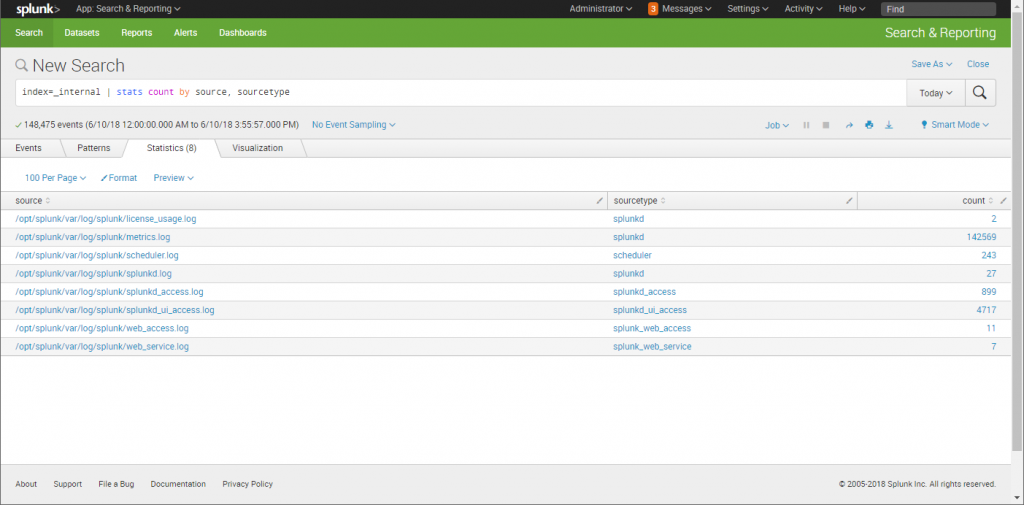
As we discovered in the previous section, Splunk creates events from each entry in a log file or data stream. You can search for specific types of events, within specified time frames, using SPL in Splunk Web. For example, let's say you create a search on the instance of Splunk on your laptop using the SPL command:
index=_internal sourcetype=splunk_web_access
if you press Enter, Splunk will return a number of events for Today or any other time frame you've selected in the Time Range drop-down. These events come from Splunk's internal web server, and reflect the format and fields that are typical of a web log:
We'll cover all of the features and details of using Splunk Web in Chapter 6, Searching with Splunk, so for now let's focus on some of the most important and useful fields in the events themselves.
The following is a screenshot of a typical Splunk event:
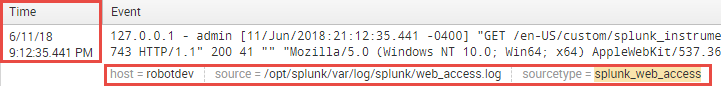
Regardless of the data source or type, Splunk always tags each event with a number of default fields; some of these come from the metadata mentioned in the discussion about the data pipeline in the previous section, and others are added at index time. There are four of these fields that you will want to become familiar with right away, as they are used extensively for filtering arguments in your SPL commands to return the events of interest. In the preceding screenshot, these key fields have been circled in red – they are as follows:
- _time (timestamp)
- host
- source
- sourcetype
The date and time reflected in the Time column is the timestamp assigned to the event, which Splunk stores in a _time field. When an event contains a timestamp, as this one does, that is, [11/Jun/2018:21:12:35.441 -0400], Splunk will parse that timestamp and save it in the _time field as an epoch value (number of seconds since 00:00:00 coordinated universal time (UTC), Thursday, 1 January 1970). If an event does not contain a timestamp, Splunk will assign the time the event was indexed to the _time field. Splunk displays this _time value in the date-time format, as seen previously, corrected for the time zone specified in the Splunk Web account settings—we'll cover this in more detail in the chapter on Splunk search.
The host field is the name or IP address of the physical device from which an event originates. You can use this field to create filters to return events from a specific host. In the preceding example, the host is a Splunk server called robotdev.
The source field identifies where the event originated. In the case of data obtained from log files, the source consists of the full pathname of the file; in the case of a network-based source, this field contains the protocol and port, such as UDP: 514. In this example, the event came from a Splunk log file in the /opt/splunk/var/log/splunk directory called web_access.log.
The sourcetype field identifies the data structure of an event (what fields the event contains, where they are, and how they're formatted), and determines how Splunk parses the data into specified fields during the indexing process. Splunk Enterprise comes with a large set of predefined source types for known data source types, and will assign the correct sourcetype to your data if it recognizes the format. You can use the sourcetype field in searches to find all the data of a certain type, regardless of the source. In the preceding example, the sourcetype is a Splunk-specific type called splunk_web_access.
The other important field that is not displayed in search results, but is essential for writing SPL commands to perform searches is the index, which as you can see was specified in the SPL command used to return the example events previously. Splunk has four internal indexes: _audit, _internal, _introspection, and _telemetry; you can view the data in these to get familiar with events in the short term. You will create and use custom indexes to store data from your company's host and device logs, and specify those indexes in your search strings.


