

In this recipe, we will build a bar chart using Show Me. The Show Me option is a handy way to get started with building Tableau visualizations. To make a visualization, you don't need to know exactly how to do it, you just need to know what fields from your data source you would like to include in it. Tableau will suggest the appropriate visualizations.
Building a bar chart using Show Me
Getting ready
To complete this recipe, you need to connect to the Baby_names.csv dataset and open a new blank worksheet.
How to do it...
We will now create the bar chart using the Show Me option, while referring to the given steps.
Creating a chart using Show Me
- Hold the Ctrl key on your keyboard, then on State under Dimensions, and then choose Frequency under Measures.
- Release the Ctrl key and click on Show Me in the top-right corner of the workbook:
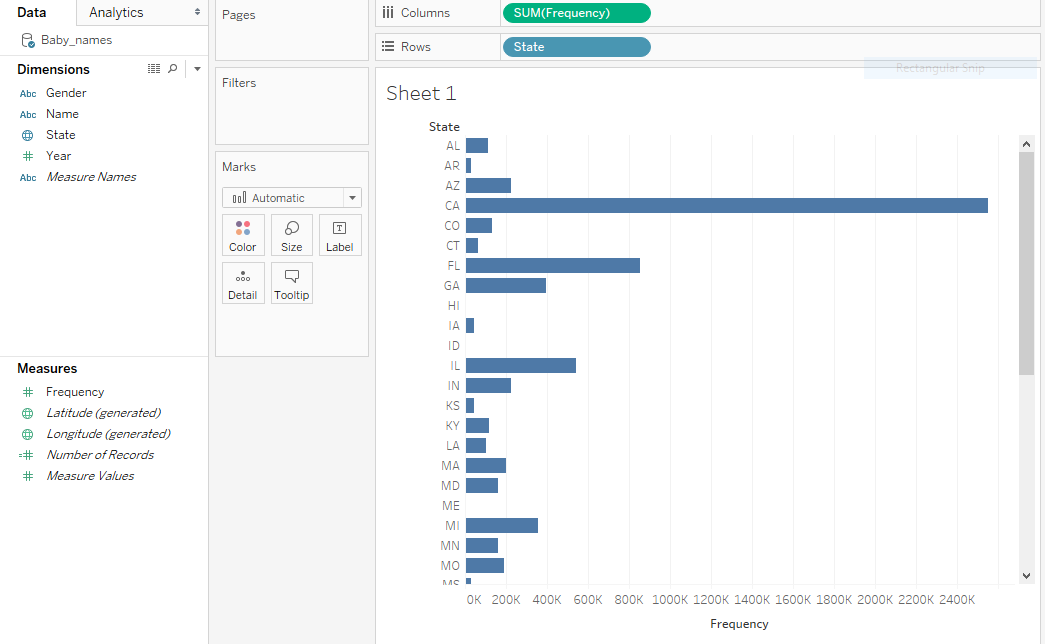
- A menu will open, offering various visualizations that are suitable for your data. Choose horizontal bars. You have just created your first visualization! Now, let's make it tidier and easier to read:
Sorting the chart
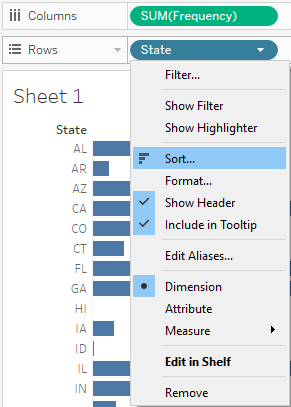
- Hover over the State pill in the Rows shelf so that a white arrows appears on it. Click on the arrow and select Sort...:
- Under Sort order, choose Descending.
- Under Sort by, select Field:
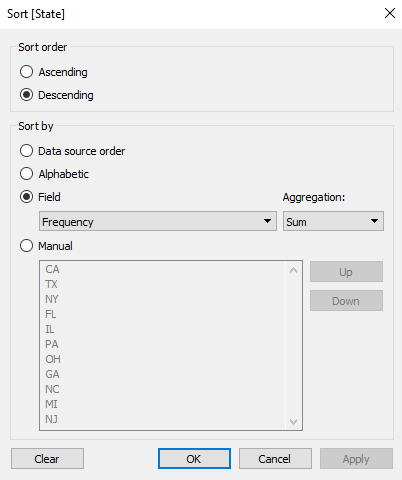
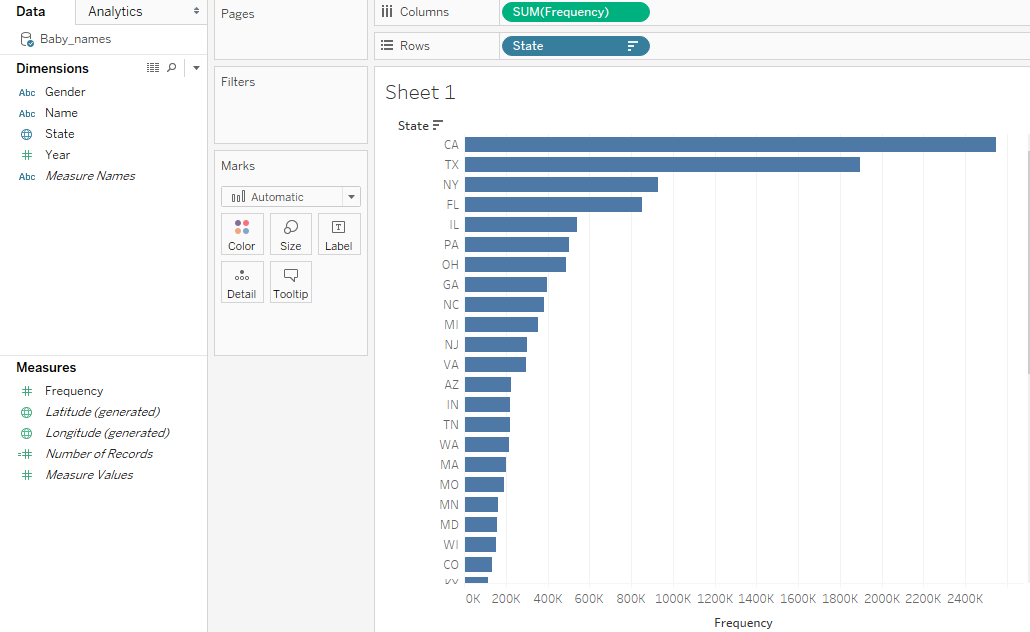
- Click on OK. The states are now sorted in descending order, by the value of Frequency, as follows:
How it works...
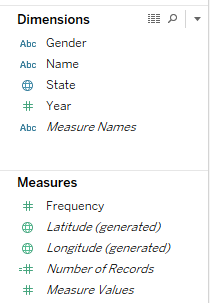
Tableau classifies the fields from a data source you connect to into two main types:
- Dimensions: This section includes qualitative and categorical values, such as dates, strings, or geographical data
- Measures: This section includes quantitative and numerical values
Measures and Dimensions can be both continuous, which means that they add axes to a view, and discrete, meaning they add field headers to a view. Continuous fields are marked with a green color, and discrete are marked with blue. However, you will notice that Measures are mostly continuous, while Dimensions are discrete:
When you select some measures and dimensions and click on Show Me, Tableau presents you with a range of basic visualizations that require the particular combination of measures and dimensions you selected.
There's more...
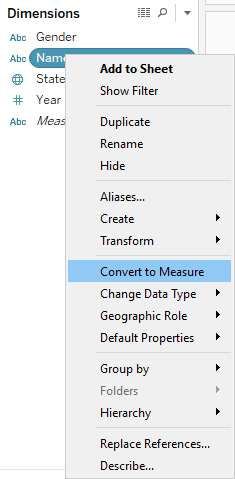
When you connect to a data source, Tableau automatically assigns type (measure or dimension) to each field in your data source. However, you can always change them manually by right-clicking on the field name under Measures/Dimensions and selecting Convert to Dimension / Convert to Measure:
See also
- For more details on data types, check out the Tableau help resource on this topic at https://onlinehelp.tableau.com/current/pro/desktop/en-us/datafields_typesandroles.html