Book Image

Hands-On Financial Modeling with Microsoft Excel 2019

By : Shmuel Oluwa
Book Image

Hands-On Financial Modeling with Microsoft Excel 2019

By: Shmuel Oluwa

Overview of this book

Financial modeling is a core skill required by anyone who wants to build a career in finance. Hands-On Financial Modeling with Microsoft Excel 2019 explores terminologies of financial modeling with the help of Excel. This book will provides you with an overview of the steps you should follow to build an integrated financial model. You will explore the design principles, functions, and techniques of building models in a practical manner. Starting with the key concepts of Excel, such as formulas and functions, you will learn about referencing frameworks and other advanced components for building financial models. Later chapters will help you understand your financial projects, build assumptions, and analyze historical data to develop data-driven models and functional growth drivers. The book takes an intuitive approach to model testing and covers best practices and practical use cases. By the end of this book, you will have examined the data from various use cases, and have the skills you need to build financial models to extract the information required to make informed business decisions.
Table of Contents (15 chapters)
Free Chapter
1
Section 1: Financial Modeling - Overview
4
Section 2: The Use of Excel - Features and Functions for Financial Modeling
7
Section 3: Building an Integrated Financial Model

Using direct and indirect methods

There are two methods in sensitivity analysis: the direct and indirect methods. Both methods make use of data tables that can be found under What If in the Forecast group on the Data ribbon in Excel. The following is a screenshot of the location of the Data Table... option:

In order to make use of the data table, you must structure your data in a particular way. The following screenshot shows the layout for a data table:

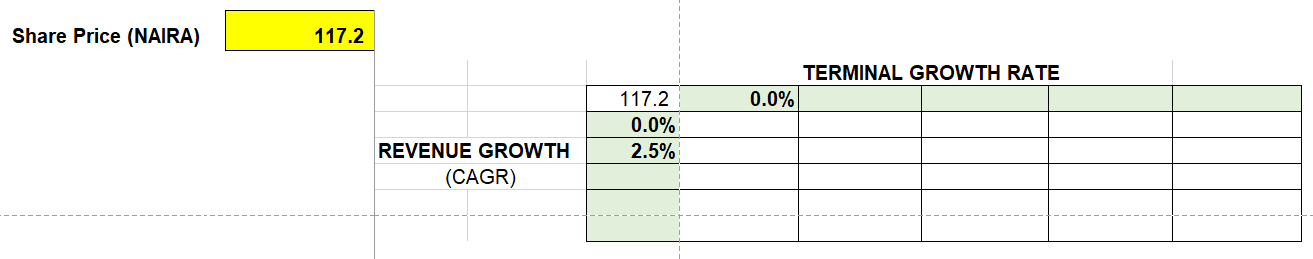
The cell in the top-left corner of the table layout must be related to the target value share price, whose behavior we wish to observe. That specific position is essential for the data table function to work. However, since it will not be used for anything else, it is shown here in a white font color, making it invisible to the naked eye, so as not to cause any distraction.

The row input values are entered across the top row...