Perform the following steps to implement histogram matching:
- Let's implement the histogram-matching algorithm with the hist_matching() function, which accepts the original and the template image's cdf along with the original image:
def hist_matching(c, c_t, im):
 b = np.interp(c, c_t, np.arange(256))
             # find closest matches to b_t
 pix_repl = {i:b[i] for i in range(256)}
             # dictionary to replace the pixels
 mp = np.arange(0,256)
 for (k, v) in pix_repl.items():
  mp[k] = v
 s = im.shape
 im = np.reshape(mp[im.ravel()], im.shape)
 im = np.reshape(im, s)
 return im
- Compute cdf of an image with the following function:
def cdf(im):
 c, b = cumulative_distribution(im)
 for i in range(b[0]):
  c = np.insert(c, 0, 0)
 for i in range(b[-1]+1, 256):
  c = np.append(c, 1)
 return c
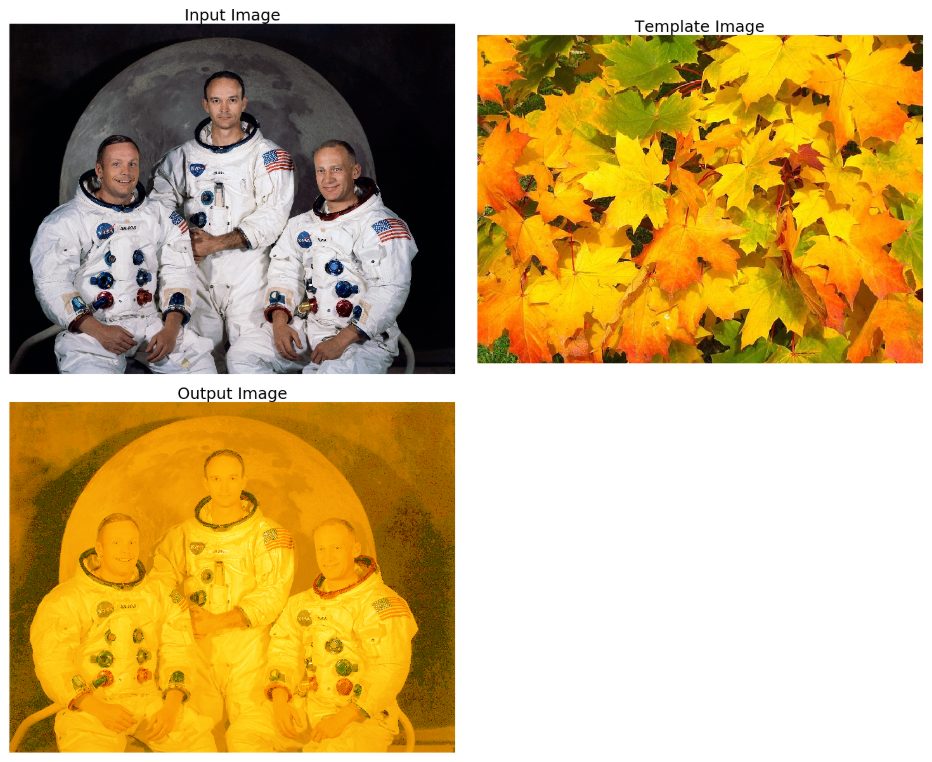
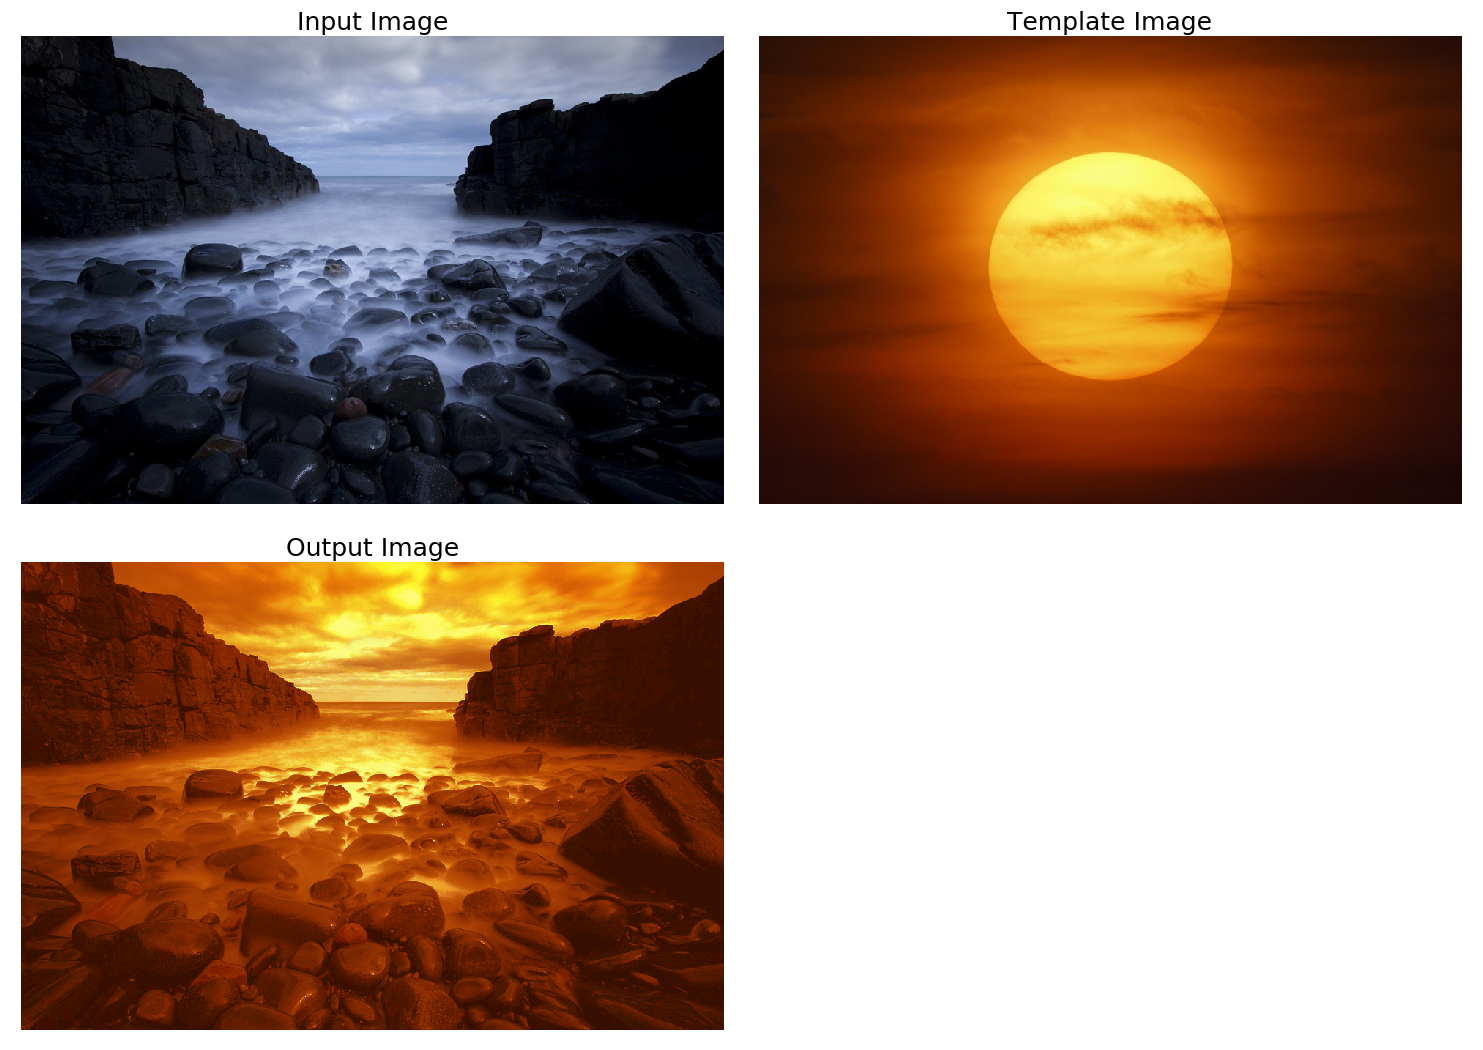
- Finally, read the input and template images, compute their cdfs, and create the output image with the hist_matching() function. Plot the input, template, and output images by running the following code:
im = imread('images/goddess.png').astype(np.uint8)
im_t = imread('images/leaves.png')

im1 = np.zeros(im.shape).astype(np.uint8)
for i in range(3):
 c = cdf(im[...,i])
 c_t = cdf(im_t[...,i])
 im1[...,i] = hist_matching(c, c_t, im[...,i])

plt.figure(figsize=(20,17))
plt.subplots_adjust(left=0, top=0.95, right=1, bottom=0, \
                    wspace=0.05, hspace=0.05)
plt.subplot(221), plt.imshow(im), plt.axis('off'), \
                    plt.title('Input Image', size=25)
plt.subplot(222), plt.imshow(im_t), plt.axis('off'), \
                    plt.title('Template Image', size=25)
plt.subplot(223), plt.imshow(im1[...,:3]), plt.axis('off'), \
                    plt.title('Output Image', size=25)
plt.show()