

In this section, we're going to use decision trees to predict student performance using the students, past performance data. We'll use the student performance dataset, which is available on the UC Irvine machine learning repository at https://archive.ics.uci.edu/ml/datasets/student+performance. Our final goal is to predict whether the student has passed or failed. The dataset contains the data of about 649 students, with and 30 attributes for each student. The attributes formed are mixed categorically – word and phrase, and numeric attributes. These mixed attributes cause a small problem that needs to be fixed. We will need to convert those word and phrase attributes into numbers.
The following screenshot shows the first half of the attributes from the data:
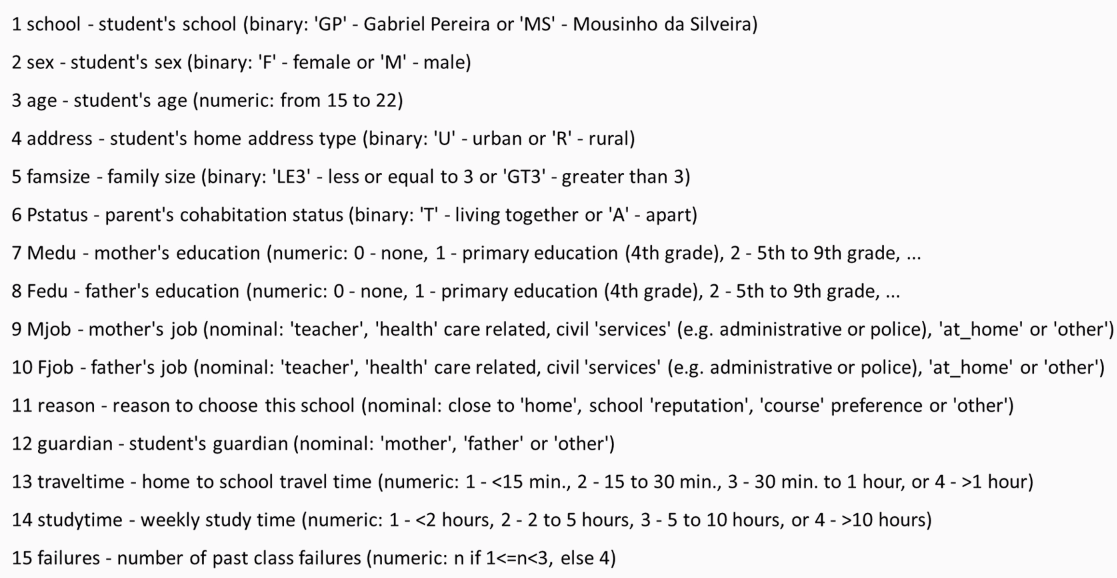
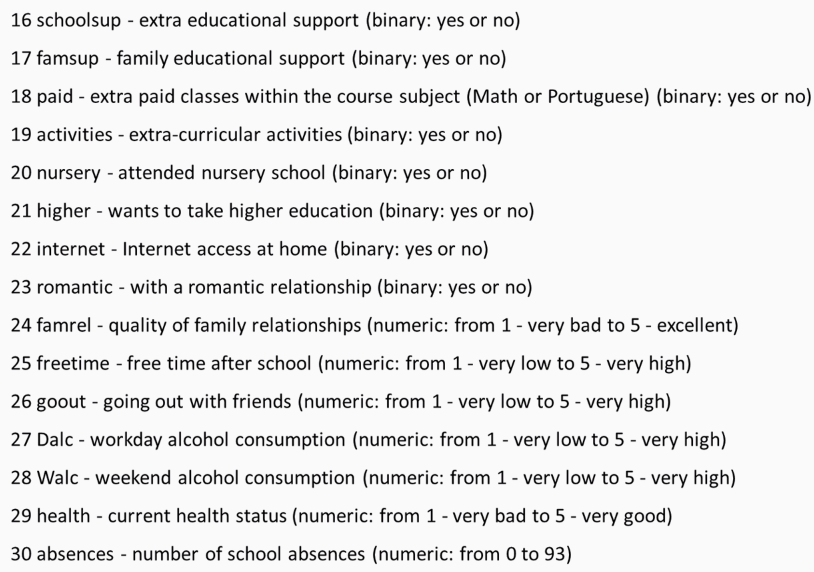
You must have noticed how some of the attributes are categorical, such as the name of the school; sex; Mjob, which is the mother's occupation; Fjob, which is the father's occupation; reason; and guardian. Others, such as age and traveltime, are numeric. The following screenshot shows the second half of the attributes from the data:
It is clear that some of the attributes are better predictors, such as absences and the number of past failures, while others attributes are probably less predictive, such as whether or not the student is in a romantic relationship or whether the student's guardian is the mother, father, or someone else. The decision tree will attempt to identify the most important or predictive attributes using this information gain provided. We'll be able to look at the resulting tree and identify the most predictive attributes because the most predictive attributes will be the earliest questions.
The original dataset had three test scores: G1, G2, and G3. Where G1 would be first grade, G2 being the second grade, and G3 being the final grade. We will simplify the problem by just providing pass or fail. This can be done by adding these three scores and checking whether the sum is sufficiently large enough which is 35. That brings us to about a 50% split of students passing and failing, giving us a balanced dataset. Now let's look at the code:
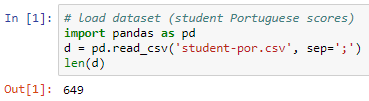
We import the dataset (student-por.csv), which comes with semicolons instead of commas; hence, we mention the separators as semicolons. To cross verify, we will find the number of rows in the dataset. Using the length variable, we can see that there are 649 rows.
Next we add columns for pass and fail. The data in these columns would contain 1 or 0, where 1 means pass and 0 means fail. We are going to do that by computing with every row what the sum of the test scores would be. This will be calculated as if the sum of three score is greater than or equal to 35, 1 is given to the student and failing to that rule 0 is given to the student.
We need to apply this rule on every row of the dataset, and this will be done using the apply function, which is a feature of Pandas. Here axis=1 means use apply per row and axis=0 would mean apply per column. The next line means that a variable needs to be dropped: either G1, G2, G3. The following screenshot of the code will provide you with an idea of what we just learned:

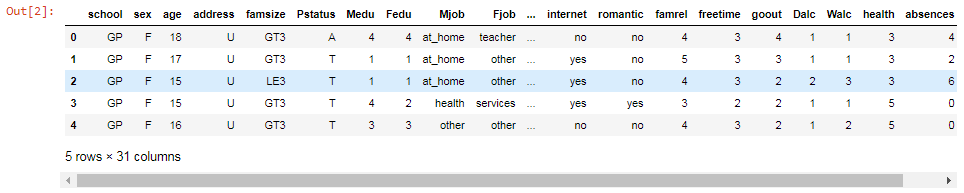
The following screenshot shows the first 5 rows of the dataset and 31 columns. There are 31 columns because we have all the attributes plus our pass and fail columns:
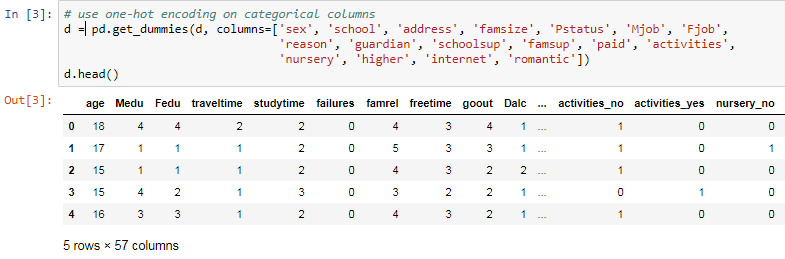
As mentioned before, some of these columns are words or phrases, such as Mjob, Fjob, internet, and romantic. These columns need to be converted into numbers, which can be done using the get_dummies function, which is a Pandas feature, and we need to mention which columns are the ones that we want to turn into numeric form.
In the case of Mjob, for example, the function it is going to look at all the different possible answers or the values in that column and it's going to give each value a column name. These columns will receive names such as rename the columns to Mjobat_home, Mjobhealth, or Mjob. These new columns, for example, the Mjob at_home column will have value 1 and the rest will have 0. This means only one of the new columns generated will have one.
This is know as one-hot encoding. The reason this name was given is for example, imagine some wires going into a circuit. Suppose in the circuit there are five wires, and you want use one-hot encoding method, you need to activate only one of these wires while keeping the rest of wires off.
On performing get_dummies function on our dataset, You can notice for example activities_no and activities_yes columns. The originally associated columns that said no had 1 as value under activies_no column followed by 0. The same as for activities_yes had yes it would have a value 0 followed by 1 for others. This led to creation of many more new columns around 57 in total but this made our dataset full of numeric data. The following screenshot shows the columns activities_yes and activities_no columns:
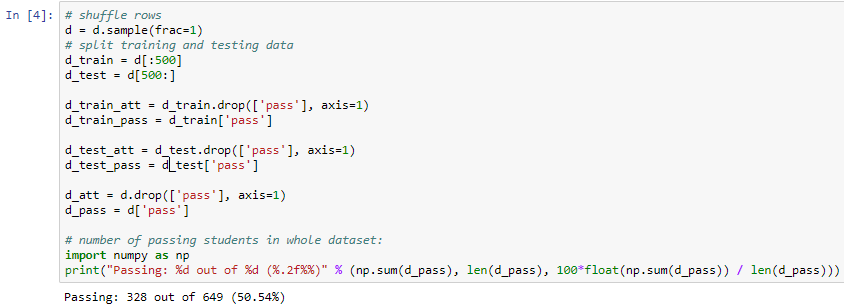
Here we need to shuffle the rows and produce a training set with first 500 rows and rest 149 rows for test set and then we just need to get attributes form the training set which means we will get rid of the pass column and save the pass column separately. The same is repeated for the testing set. We will apply the attributes to the entire dataset and save the pass column separately for the entire dataset.
Now we will find how many passed and failed from the entire dataset. This can be done by computing the percentage number of passed and failed which will give us a result of 328 out of 649. This being the pass percentage which is roughly around 50% of the dataset. This constitutes a well-balanced dataset:
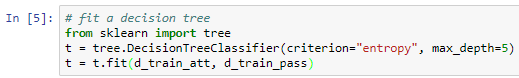
Next, we start building the decision tree using the DecisionTreeClassifier function from the scikit-learn package, which is a class capable of performing multi-class classification on a dataset. Here we will use the entropy or information gain metric to decide when to split. We will split at a depth of five questions, by using max_depth=5 as an initial tree depth to get a feel for how the tree is fitting the data:
To get an overview of our dataset, we need to create a visual representation of the tree. This can be achieved by using one more function of the scikit-learn package: expoert_graphviz. The following screenshot shows the representation of the tree in a Jupyter Notebook:
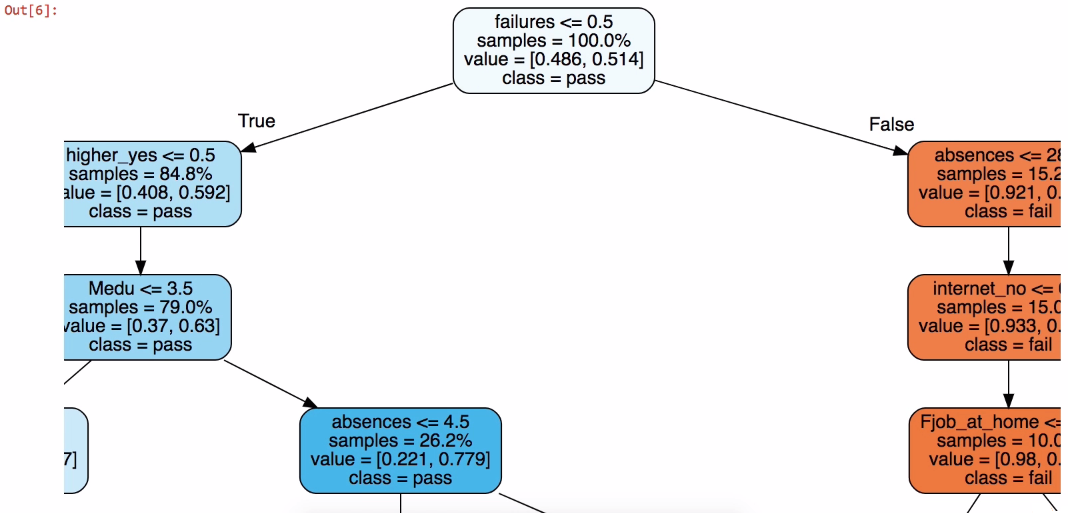
This is for representation, more can be seen on scrolling in Jupyter output
It is pretty much easy to understand the previous representation that the dataset is divided into two parts. Let's try to interpret the tree from the top. In this case if failure is greater than or equal to 0.5, that means it is true and it placed on left-hand side of the tree. Consider tree is always true on left side and false on right side, which means there are no prior failures. In the representation we can see left side of the tree is mostly in blue which means it is predicting a pass even though there are few questions as compared to the failure maximum of 5 questions. The tree is o n right side if failure is less than 0.5, this makes the student fail, which means the first question is false. Prediction is failure if in orange color but as it proceeds further to more questions since we have used max_depth = 5.
The following code block shows a method to export the visual representation which by clicking on Export and save to PDF or any format if you want to visualize later:

Next we check the score of the tree using the testing set that we created earlier:
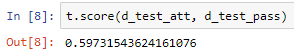
The result we had was approximately 60%. Now let's cross verify the result to be assured that the dataset is trained perfectly:
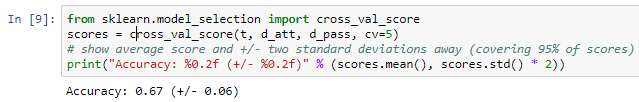
Performing cross-validation on the entire dataset which will split the data on a of 20/80 basis, where 20% is the on testing set and 80% is on the training set. The average result is 67%. This shows that we have a well-balanced dataset. Here we have various choices to make regarding max_depth:
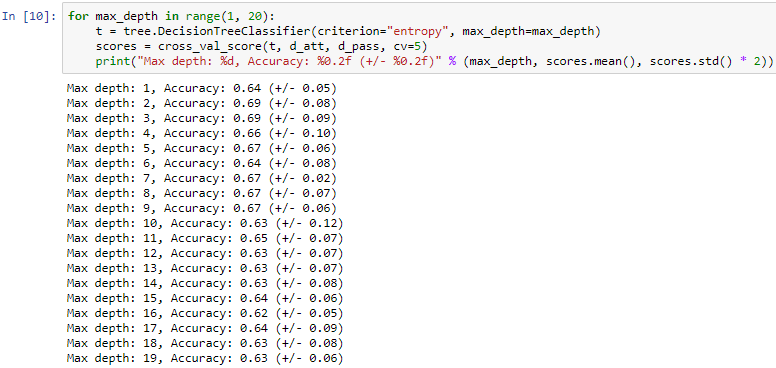
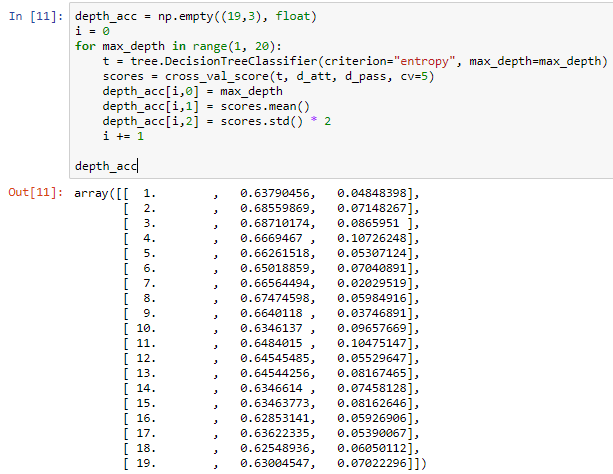
We use various max_depth values from 1 to 20, Considering we make a tree with one question or with 20 questions having depth value of 20 which will give us questions more than 20 which is you will have to go 20 steps down to reach a leaf node. Here we again perform cross- validation and save and print our answer. This will give different accuracy and calculations. On analyzing it was found that on have depth of 2 and 3 the accuracy is the best which was compared accuracy from the average we found earlier.
The following screenshot shows the data that we will be using to the create graph:
The error bars shown in the following screenshot are the standard deviations in the score, which concludes that a depth of 2 or 3 is ideal for this dataset, and that our assumption of 5 was incorrect:
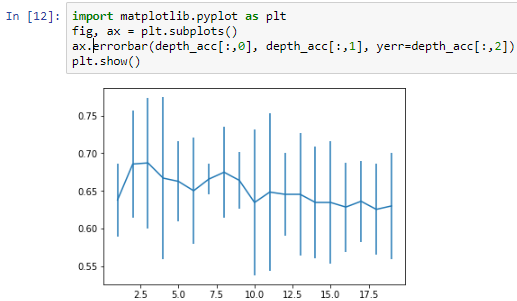
More depth doesn't give any more power, and just having one question, which would be did you fail previously?, isn't going to provide you with the same amount of information as two or three questions would.
Our model shows that having more depth does not necessarily help, nor does having a single question of did you fail previously? provide us with the same amount of information as two or three questions would give us.