Book Image

Hands-On Dashboard Development with Shiny

By : Chris Beeley
Book Image

Hands-On Dashboard Development with Shiny

By: Chris Beeley

Overview of this book

Although vanilla Shiny applications look attractive with some layout flexibility, you may still want to have more control over how the interface is laid out to produce a dashboard. Hands-On Dashboard Development with Shiny helps you incorporate this in your applications. The book starts by guiding you in producing an application based on the diamonds dataset included in the ggplot2 package. You’ll create a single application, but the interface will be reskinned and rebuilt throughout using different methods to illustrate their uses and functions using HTML, CSS, and JavaScript. You will also learn to develop an application that creates documents and reports using R Markdown. Furthermore, the book demonstrates the use of HTML templates and the Bootstrap framework. Moving along, you will learn how to produce dashboards using the Shiny command and dashboard package. Finally, you will learn how to lay out applications using a wide range of built-in functions. By the end of the book, you will have an understanding of the principles that underpin layout in Shiny applications, including sections of HTML added to a vanilla Shiny application, HTML interfaces written from scratch, dashboards, navigation bars, and interfaces.
Table of Contents (5 chapters)

Info boxes and value boxes

In this section, we're going to look at more UI elements that you can use to make your content professional: info boxes and value boxes. In most cases, you will want to make their content dynamic. So, we will look to at how to render them on the server side.

Let's look at the application:

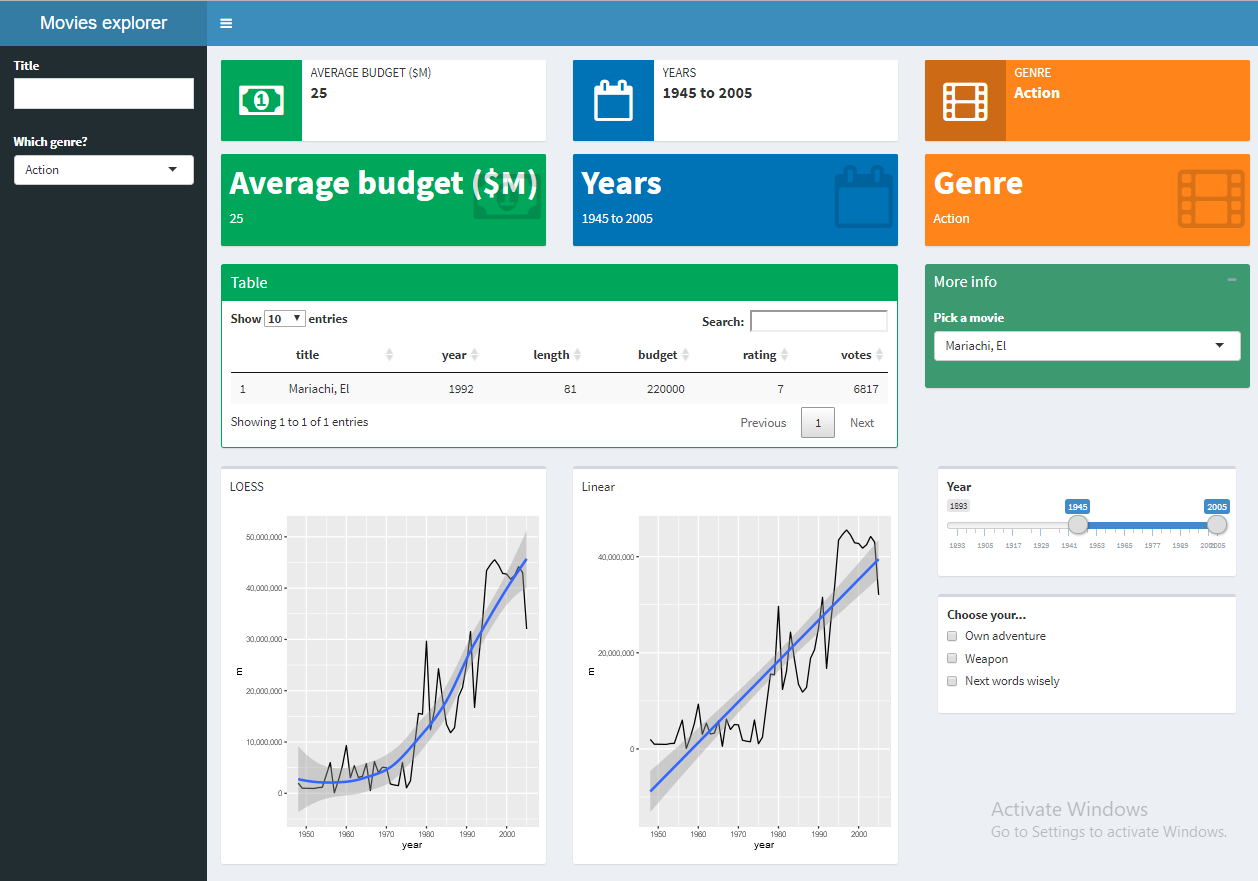
The top row is made up of info boxes. They can be given a color, and this color can be used just in the side panel or throughout, as in the final element on this row. The second row is very similar and it's made up of value boxes. They work much the same way, but they look a little different. As you can see, the bottom row replicates the content of the top row, and the dynamic box reacts in a simple way to the control of the application. The boxes react to the Which genre? control, and the blue boxes react to the Year. In a real application, of course...