Book Image

R Statistics Cookbook

By : Francisco Juretig
2 (2)
Book Image

R Statistics Cookbook

2 (2)
By: Francisco Juretig

Overview of this book

R is a popular programming language for developing statistical software. This book will be a useful guide to solving common and not-so-common challenges in statistics. With this book, you'll be equipped to confidently perform essential statistical procedures across your organization with the help of cutting-edge statistical tools. You'll start by implementing data modeling, data analysis, and machine learning to solve real-world problems. You'll then understand how to work with nonparametric methods, mixed effects models, and hidden Markov models. This book contains recipes that will guide you in performing univariate and multivariate hypothesis tests, several regression techniques, and using robust techniques to minimize the impact of outliers in data.You'll also learn how to use the caret package for performing machine learning in R. Furthermore, this book will help you understand how to interpret charts and plots to get insights for better decision making. By the end of this book, you will be able to apply your skills to statistical computations using R 3.5. You will also become well-versed with a wide array of statistical techniques in R that are extensively used in the data science industry.
Table of Contents (12 chapters)

Creating diagrams via the DiagrammeR package

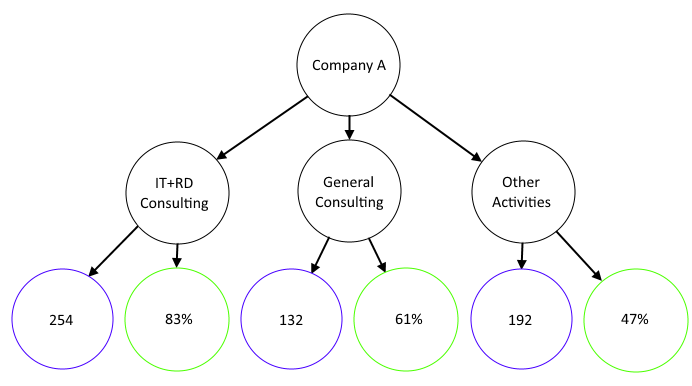
The ggplot package greatly enhances R's plotting capabilities, but in some situations, this is not sufficient. In situations whenever we want to plot relationships between entities or elements, we need a different tool. Diagrams are well suited for this, but drawing them manually is very hard (since we need to draw each square or circle, plus the text, plus the relationships between the elements).

The DiagrammeR package allows us to create powerful diagrams, supporting the Graphviz syntax. Using it is actually simple. We will essentially define nodes, and we will then tell DiagrammeR how we want to connect those nodes. Of course, we can control the format of those diagrams (color, shapes, arrow types, themes, and so on).

Getting ready

In order to run this example, you need to install the DiagrammeR package using install.packages("DiagrammeR").

How to do it...

In this recipe, we will draw a diagram depicting a company structure. The company is split into three groups, and within each group we will draw the sales in blue and the market share in green.

  1. Import the library:
library('DiagrammeR')
  1. We define the diagram using Graphviz's dot syntax. Essentially, it needs three parts—the graph part controls the global elements of the diagram, the node part defines the nodes, and the edge part defines the edges:
grViz("
digraph dot {

graph [layout = dot]

node [shape = circle,
style = filled,
color = grey,
label = '']

node [fillcolor = white,fixedsize = true, width = 2]
a[label = 'Company A']

node [fillcolor = white]
b[label = 'IT+RD Consulting'] c[label = 'General Consulting'] d[label = 'Other Activities']

node [fillcolor = white]

edge [color = grey]
a -> {b c d}
b -> {e[label = '254';color=blue] f[label = '83%';color=green]}
c -> {k[label = '132';color=blue] l[label = '61%';color=green]}
d -> {q[label = '192';color=blue] r[label = '47%';color=green]}
}")

How it works...

Inside our diagram, we define two main objects, nodes and edges. We define two nodes, and we define multiple edges that specify how everything will be connected. For each element, we can define the label that will be shown, and the color. The label and color arguments are used to specify the text and color that will be displayed for each node.

We use the fixedsize and the width parameters to force the elements in the corresponding node to have the same size. Had we not, then the circles for those nodes would be of different sizes.

The grViz() function is used to build the Graphviz diagram, as shown in the following screenshot:

See also