Book Image

Elasticsearch 7 Quick Start Guide

By : Anurag Srivastava, Douglas Miller
Book Image

Elasticsearch 7 Quick Start Guide

By: Anurag Srivastava, Douglas Miller

Overview of this book

Elasticsearch is one of the most popular tools for distributed search and analytics. This Elasticsearch book highlights the latest features of Elasticsearch 7 and helps you understand how you can use them to build your own search applications with ease. Starting with an introduction to the Elastic Stack, this book will help you quickly get up to speed with using Elasticsearch. You'll learn how to install, configure, manage, secure, and deploy Elasticsearch clusters, as well as how to use your deployment to develop powerful search and analytics solutions. As you progress, you'll also understand how to troubleshoot any issues that you may encounter along the way. Finally, the book will help you explore the inner workings of Elasticsearch and gain insights into queries, analyzers, mappings, and aggregations as you learn to work with search results. By the end of this book, you'll have a basic understanding of how to build and deploy effective search and analytics solutions using Elasticsearch.
Table of Contents (10 chapters)

Elastic Stack architecture

As mentioned previously, the Elastic Stack consists of four components—Elasticsearch, Kibana, Logstash, and Beats. To understand the architecture of the stash, let's look in more detail at some important terms. Please refer to the following diagram to learn more about these components:

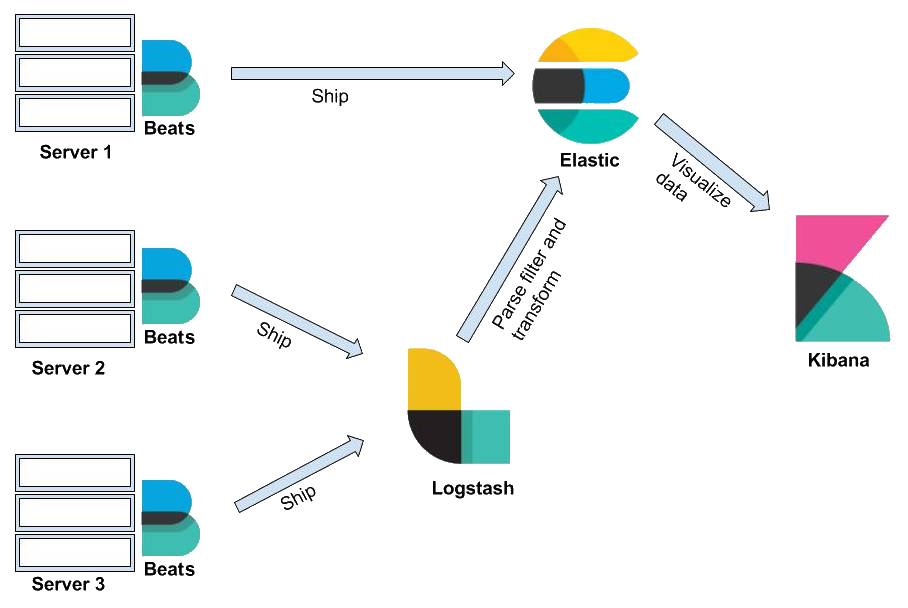
As you can see, in Elastic Stack, Beats and Logstash send data to Elasticsearch, where the data is stored. Kibana is the UI of Elastic Stack; it reads the Elasticsearch data to create graphical charts and more. Now, let's cover each of the components in detail, so let's start with Elasticsearch.

Elasticsearch

Elasticsearch provides the searching and management functionality of a document-oriented database. Documents are stored in JSON form, and, with the help of a query DSL, any document can be retrieved. It uses an HTTP interface, and REST APIs are used to index, search, retrieve, delete, or update the database. Elasticsearch is used by so many because it allows the user to write a single query that can perform complex searches (such as by applying certain conditions). Elasticsearch has three main uses: web search, log analysis, and big data analytics. It is widely used by big companies such as Netflix, Stack Overflow, and Accenture (among others) to monitor performance, analyze user operations, and keep track of security logs.

A relational database system is a cluster of databases in which each database is called an index. The tables in the index are named type, each row is a document, and each column is a field. The process of defining how a document and its fields are stored and indexed is called mapping. A query DSL is a SQL query that requests information from a database. A cluster is a collection of servers that contain the entirety of the data. The default name for the cluster is Elasticsearch. Each cluster is made up of nodes, which are the individual servers. They store the data and are indexed to the cluster. A collection of documents that contain similar characteristics is called an index. There is no limit on how many indices there can be in a cluster.

The information that can be indexed is called a document. It is expressed in JSON format, and it can store various pieces of data. Shards are subdivisions of an index and can help in cases of strict hardware limits, or when the lag time increases due to large amounts of data. Shards split data horizontally and are considered to be indices themselves. Distribution and even parallel operations can be performed on multiple shards. Replicas are copies of a shard or a node in case of failures. They are allocated to a different node and allow scalability because searches can be performed in parallel on all replicas. The features of Elasticsearch are based on REST APIs. The Index API is used to add a JSON form document to an index and make it accessible for searches. The Get API is used to retrieve those documents from their index, while the Delete API removes the document entirely. The Update API updates the document according to a script.

Kibana

Kibana is an open source interactive visualization and analytics plugin used by Elastic. It offers the user different ways to represent their data: charts, tables, maps, dashboards, and so on. It also lets the user perform searches and visualize and interact with data to perform advanced analysis.

Kibana uses a browser-based interface that is incredibly easy to use, and it displays real-time Elasticsearch queries. It has a machine learning feature that models the behavior of the data, learning trends, and more so that anomalies are detected as soon as possible.

Logstash

Logstash is an open source pipeline that collects data from multiple sources, processes them, and forwards events and log messages along with the data to a stash—in this case, to Elasticsearch. Its architecture makes it easy to mix and match various inputs, filters, and outputs. As with Elasticsearch, Logstash allows users to add plugins and contribute, creating flexibility. It transforms data into JSON documents, which are then delivered to Elasticsearch. But as well as a pipeline, it can be used for analysis, archiving, monitoring, and alerting.

The operating procedure starts with an input plugin that collects the data, which is then processed using filters that modify and annotate the event data. There are multiple pipelines that Logstash uses based on the configuration files. The user can specify single or multiple configuration files to create a single pipeline. The use of multiple pipelines is perfect for different logical flows, as it reduces the conditions and complexity of one pipeline. This configuration also offers easier maintenance.

An input plugin is a component that allows a specified source of events to be accessed by Logstash. A filter plugin then processes the event data, and this is often dependent on the characteristics of the event. An output plugin then sends the data to the destination specified. Plugin management is a script that manages the plugins by installation, listing, or removal.

Beats

Beats are basically lightweight data shippers that are designed for a very specific purpose. They can be installed on a standalone server, from where they fetch data or metrics and send them to Elasticsearch or Logstash. There are many types of Beats that we can use as needed; for example, if we want to process log file data, then we can use Filebeat, Packetbeat can be used to fetch network data, and Winlogbeat can be used if we want to fetch Windows events logs. Beats not only send data from a server, but also provides built-in dashboards and visualizations that we can easily configure in Kibana. Let's now discuss some of the important Elastic Beats.

Filebeat

Filebeat is a lightweight data shipper that can be installed on different servers to read file data. Filebeat monitors the log files that we specify in the configuration, collects the data from there in an incremental way, and then forwards them to Logstash or directly into Elasticsearch for indexing. After configuring Filebeat, it starts the input as per the given instructions. Filebeat starts a harvester to read a single log to get the incremental data for each separate file. Harvester sends the log data to libbeat, and then libbeat aggregates all events and sends the data to the output as per the given instructions, such as in Elasticsearch, Kafka, or Logstash. This way, we can configure Filebeat on any server to read the file data and send it to Elasticsearch for further analysis.

Metricbeat

Metricbeat is again a lightweight data shipper that can be installed on any server to fetch system metrics. Metricbeat helps us to collect metrics from systems and services with which we can monitor the servers. It fetches the metrics from the servers where they are installed and running. Metricbeat ships the collected system metrics data to Elasticsearch or Logstash for analysis. Metricbeat can monitor many different services; some of these are as follows:

  • MySQL
  • PostgreSQL
  • Apache
  • NGINX
  • Redis
  • HAProxy

Here, I have listed only some of the services, but Metricbeat supports a lot more than that.

Packetbeat

Using Packetbeat, we can analyze network packets in real time. Packetbeat data can be pushed into Elasticsearch, where it can be stored. We can configure Kibana to use the Metricbeat data from Elasticsearch for real-time application monitoring. Packetbeat is very effective at diagnosing network-related issues because it captures the network traffic between our application servers and it decodes the application layer protocols, such as HTTP, Redis, and MySQL. Packetbeat supports many different protocols; some of these are as follows:

  • HTTP
  • MySQL
  • PostgreSQL
  • Redis
  • MongoDB
  • Memcache
  • TLS
  • DNS

We can configure Packetbeat to send our network packet data directly to Elasticsearch or to Logstash. We just need to install and configure it on the server where you want to monitor the network packets, and we can start getting the packet data into Elasticsearch. Once Elasticsearch starts getting Packetbeat data, we can create a packet data monitoring dashboard using Kibana. Packetbeat also provides a custom dashboard that we can easily configure using the Packetbeat configuration file.

Auditbeat

We can install and configure Auditbeat on any server to audit the activities of users and processes. Auditbeat is a lightweight data shipper that sends the data directly to Elasticsearch or Logstash. Sometimes, it is difficult to track changes in binaries or configuration files because we never maintain the audit trail for the same. Auditbeat is helpful here because it detects changes to critical files, such as different configuration files and binaries. Auditbeat can help us to take that data and push it to Elasticsearch, from where Kibana can be configured to create dashboards.

Winlogbeat

Winlogbeat is a data shipper that we can use to ship Windows event logs to Logstash or the Elasticsearch cluster. It keeps a watch on Windows machines, reads from different Windows event logs, and sends them to Logstash or Elasticsearch in a timely manner. Winlogbeat can send different types of events, as follows:

  • Hardware events
  • Security events
  • System events
  • Application events

Winlogbeat sends structured data to Logstash or Elasticsearch after reading raw event data, which makes it easier to apply filter and aggregation on the data.

Heartbeat

Heartbeat is another lightweight data shipper that we can use to monitor a server's uptime. We can install Heartbeat on a remote server on which it periodically checks the status of different services and tells us whether they are available. The major difference between Metricbeat and Heartbeat is that Metricbeat tells us whether that server is up or down, while Heartbeat tells us whether services are reachable. Heartbeat is quite similar to the ping command, which tells us whether the server is responding.