The main objective of machine learning is to build models by interpreting data. To do so, it is highly important to feed the data in a way that is readable by the computer. To feed data into a scikit-learn model, it must be represented as a table or matrix of the required dimension, which will be discussed in the following section.
Tables of Data
Most tables fed into machine learning problems are two-dimensional, meaning that they contain rows and columns. Conventionally, each row represents an observation (an instance), whereas each column represents a characteristic (feature) of each observation.
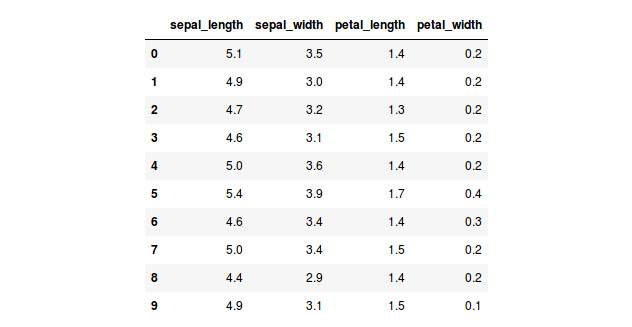
The following table is a fragment of a sample dataset of scikit-learn. The purpose of the dataset is to differentiate from among three types of iris plants based on their characteristics. Hence, in the table, each row embodies a plant and each column denotes the value of that feature for every plant:
Figure 1.1: A table showing the first 10 instances of the iris dataset
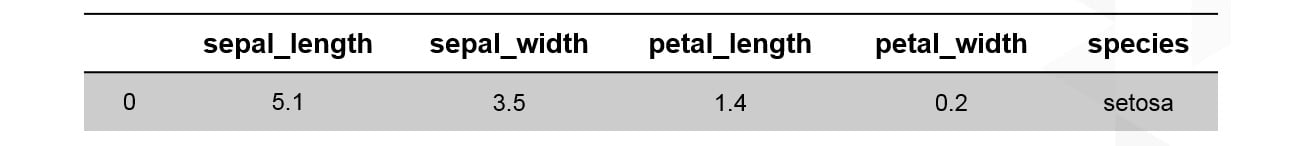
From the preceding explanation, the following snapshot shows data that corresponds to a plant with sepal length of 5.1, sepal width of 3.5, petal length of 1.4, and petal width of 0.2. The plant belongs to the setosa species:
Figure 1.2: The first instance of the iris dataset
Note
When feeding images to a model, the tables become three-dimensional, where the rows and columns represent the dimensions of the image in pixels, while the depth represents its color scheme. If you are interested, feel free to explore more on the subject of convolutional neural networks.
Features and Target Matrices
For many data problems, one of the features of your dataset will be used as a label. This means that out of all the other features, this one is the target to which the model should generalize the data. For example, in the preceding table, we might choose the species as the target feature, and so we would like the model to find patterns based on the other features to determine whether a plant belongs to the setosa species. Therefore, it is important to learn how to separate the target matrix from the features matrix.
Features Matrix: The features matrix comprises data from each instance for all features, except the target. It can be either created using a NumPy array or a Pandas DataFrame, and its dimensions are [n_i, n_f], where n_i denotes the number of instances (such as a person) and n_f denotes the number of features (such as age). Generally, the features matrix is stored in a variable named X.
Target Matrix: Different than the features matrix, the target matrix is usually one-dimensional since it only carries one feature for all instances, meaning that its length is of value n_i (number of instances). Nevertheless, there are some occasions where multiple targets are required, and so the dimensions of the matrix become [n_i, n_t], where n_t is the number of targets to consider.
Similar to the features matrix, the target matrix is usually created as a NumPy array or a Pandas series. The values of the target array may be discrete or continuous. Generally, the target matrix is stored in a variable named Y.
Exercise 1: Loading a Sample Dataset and Creating the Features and Target Matrices
Note
All of the exercises and activities in these chapters will be primarily developed in Jupyter Notebook. It is recommended to keep a separate notebook for different assignments, unless advised otherwise. Also, to load a sample dataset, the seaborn library will be used, as it displays the data as a table. Other ways to load data will be explained in further sections.
In this exercise, we will be loading the iris dataset, and creating features and target matrices using this dataset.
Note
For the exercises and activities within this chapter, you will need to have Python 3.6, seaborn, Jupyter, Matplotlib, and Pandas installed on your system.
- Open a Jupyter Notebook to implement this exercise. In the cmd or terminal, navigate to the desired path and use the following command:
jupyter notebook.
- Load the
iris dataset using the seaborn library. To do so, you first need to import the seaborn library, and then use the load_dataset() function, as shown in the following code:import seaborn as sns
iris = sns.load_dataset('iris')As we can see from the preceding code, after importing the library, a nickname is given to facilitate its use along with the script.
The load_dataset() function loads datasets from an online repository. The data from the dataset is stored in a variable named iris.
- Create a variable,
X, to store the features. Use the drop() function to include all of the features but the target, which in this case is named species. Then, print out the top 10 instances of the variable:X = iris.drop('species', axis=1)
X.head(10)Note
The axis parameter in the preceding snippet denotes whether you want to drop the label from rows (axis = 0) or columns (axis = 1).
The printed output should look as follows:
Figure 1.3: A table showing the first 10 instances of the features matrix
- Print the shape of your new variable using the
X.shape command:X.shape
(150, 4)
The first value indicates the number of instances in the dataset (150), and the second value represents the number of features (4).
- Create a variable,
Y, that will store the target values. There is no need to use a function for this. Use indexing to grab only the desired column. Indexing allows you to access a section of a larger element. In this case, we want to grab the column named species. Then, print out the top 10 values of the variable:Y = iris['species']
Y.head(10)
The printed output should look as follows:
Figure 1.4: A screenshot showing the first 10 instances of the target matrix
- Print the shape of your new variable by using the
Y.shape command:Y.shape
(150,)
The shape should be one-dimensional with length equal to the number of instances (150).
Congratulations! You have successfully created the features and target matrices of a dataset.
Generally, the preferred way to represent data is by using two-dimensional tables, where the rows represent the number of observations, also known as instances, and the columns represent the characteristics of those instances, commonly known as features.
For data problems that require target labels, the data table needs to be partitioned into a features matrix and a target matrix. The features matrix will contain the values of all features but the target, for each instance, making it a two-dimensional matrix. On the other hand, the target matrix will only contain the value of the target feature for all entries, making it a one-dimensional matrix.
Activity 1: Selecting a Target Feature and Creating a Target Matrix
In this activity, we will attempt to load a dataset and create the features and target matrices by choosing the appropriate target feature for the objective of the study. Let's look at the following scenario: you work in the safety department of a cruise company. The company wants to include more lower-deck cabins, but it wants to be sure that the measure will not increase the number of fatalities in the case of an accident. The company has provided your team with a dataset of the Titanic passenger list to determine whether lower-deck passengers are less likely to survive. Your job is to select the target feature that most likely helps to achieve this objective.
Note
To choose the target feature, remember that the target should be the outcome to which we want to interpret the data for. For instance, if we want to know what features play a role in determining a plant's species, the species should be the target value.
Follow the steps below to complete this activity:
- Load the
titanic dataset using the seaborn library. The first couple of rows should look like this:Figure 1.5: An table showing the first 10 instances of the Titanic dataset
- Select your preferred target feature for the goal of this activity.
- Create both the features matrix and the target matrix. Make sure that you store the data from the features matrix in a variable,
X, and the data from the target matrix in another variable, Y.
- Print out the shape of each of the matrices, which should match the following values:
Features matrix: (891,14)
Target matrix: (891)
Note
The solution for this activity can be found on page 178.


 Free Chapter