
A probability distribution is a function that describes the likelihood of obtaining the possible values of a variable. There are many well-described variable distributions, such as the normal, binomial, or Poisson distributions. Some machine learning algorithms assume that the independent variables are normally distributed. Other models make no assumptions about the distribution of the variables, but a better spread of these values may improve their performance. In this recipe, we will learn how to create plots to distinguish the variable distributions in the entire dataset by using the Boston House Prices dataset from scikit-learn.
Distinguishing variable distribution
Getting ready
In this recipe, we will learn how to visualize the distributions of the variables in a dataset using histograms. For more details about different probability distributions, visit the following gallery: https://www.itl.nist.gov/div898/handbook/eda/section3/eda366.htm.
How to do it...
Let's begin by importing the necessary libraries:
- Import the required Python libraries and modules:
import pandas as pd
import matplotlib.pyplot as plt
- Load the Boston House Prices dataset from scikit-learn:
from sklearn.datasets import load_boston
boston_dataset = load_boston()
boston = pd.DataFrame(boston_dataset.data,
        columns=boston_dataset.feature_names)
- Visualize the variable distribution with histograms:
boston.hist(bins=30, figsize=(12,12), density=True)
plt.show()
The output of the preceding code is shown in the following screenshot:
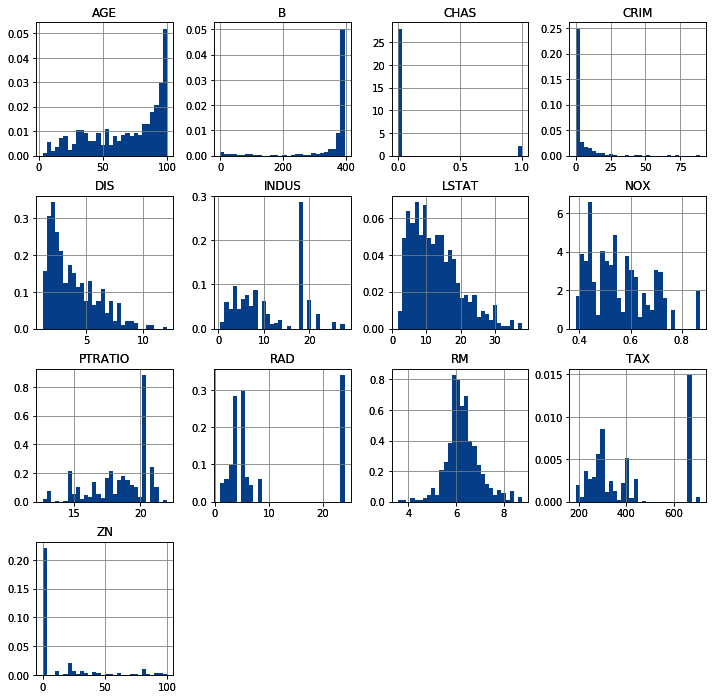
Most of the numerical variables in the dataset are skewed.
How it works...
In this recipe, we used pandas hist() to plot the distribution of all the numerical variables in the Boston House Prices dataset from scikit-learn. To load the data, we imported the dataset from scikit-learn datasets and then used load_boston() to load the data. Next, we captured the data into a dataframe using pandas DataFrame(), indicating that the data is stored in the data attribute and the variable names in the feature_names attribute.
To display the histograms of all the numerical variables, we used pandas hist(), which calls matplotlib.pyplot.hist() on each variable in the dataframe, resulting in one histogram per variable. We indicated the number of intervals for the histograms using the bins argument, adjusted the figure size with figsize, and normalized the histogram by setting density to True. If the histogram is normalized, the sum of the area under the curve is 1.
See also
For more details on how to modify a pandas histogram, visit https://pandas.pydata.org/pandas-docs/stable/reference/api/pandas.DataFrame.hist.html.