
Many machine learning algorithms are sensitive to the scale of the features. For example, the coefficients of linear models are directly informed by the scale of the feature. In addition, features with bigger value ranges tend to dominate over features with smaller ranges. Having features within a similar scale also helps algorithms converge faster, thus improving performance and training times. In this recipe, we will explore and compare feature magnitude by looking at statistical parameters such as the mean, median, standard deviation, and maximum and minimum values by leveraging the power of pandas.
Comparing feature magnitude
Getting ready
For this recipe, you need to be familiar with common statistical parameters such as mean, quantiles, maximum and minimum values, and standard deviation. We will use the Boston House Prices dataset included in scikit-learn to do this.
How to do it...
Let's begin by importing the necessary libraries and loading the dataset:
- Import the required Python libraries and classes:
import pandas as pd
from sklearn.datasets import load_boston
- Load the Boston House Prices dataset from scikit-learn into a dataframe:
boston_dataset = load_boston()
data = pd.DataFrame(boston_dataset.data, columns=boston_dataset.feature_names)
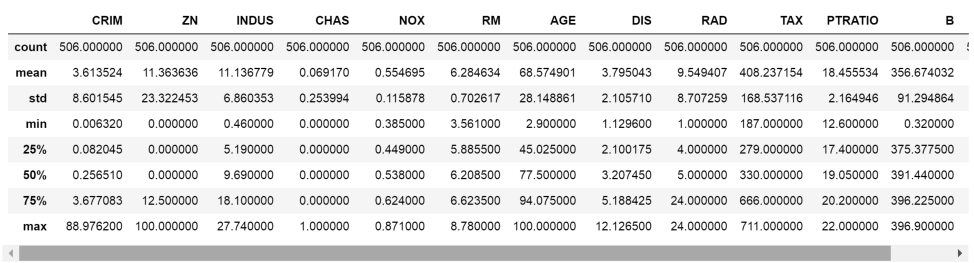
- Print the main statistics for each variable in the dataset, that is, the mean, count, standard deviation, median, quantiles, and minimum and maximum values:
data.describe()
The following is the output of the preceding code when we run it from a Jupyter Notebook:
- Calculate the value range of each variable, that is, the difference between the maximum and minimum value:
data.max() - data.min()
The following output shows the value ranges of the different variables:
CRIM        88.96988
ZN         100.00000
INDUS       27.28000
CHAS         1.00000
NOX          0.48600
RM           5.21900
AGE         97.10000
DIS         10.99690
RAD         23.00000
TAX        524.00000
PTRATIO      9.40000
B          396.58000
LSTAT       36.24000
dtype: float64
The value ranges of the variables are quite different.
How it works...
In this recipe, we used the describe() method from pandas to return the main statistical parameters of a distribution, namely, the mean, standard deviation, minimum and maximum values, 25th, 50th, and 75th quantiles, and the number of observations (count).
We can also calculate these parameters individually using the pandas mean(), count(), min(), max(), std(), and quantile() methods.
Finally, we calculated the value range by subtracting the minimum from the maximum value in each variable using the pandas max() and min() methods.