Book Image

Tableau 10 Complete Reference

By : Joshua N. Milligan, Tristan Guillevin
Book Image

Tableau 10 Complete Reference

By: Joshua N. Milligan, Tristan Guillevin

Overview of this book

Graphical presentation of data enables us to easily understand complex data sets. Tableau 10 Complete Reference provides easy-to-follow recipes with several use cases and real-world business scenarios to get you up and running with Tableau 10. This Learning Path begins with the history of data visualization and its importance in today's businesses. You'll also be introduced to Tableau - how to connect, clean, and analyze data in this visual analytics software. Then, you'll learn how to apply what you've learned by creating some simple calculations in Tableau and using Table Calculations to help drive greater analysis from your data. Next, you'll explore different advanced chart types in Tableau. These chart types require you to have some understanding of the Tableau interface and understand basic calculations. You’ll study in detail all dashboard techniques and best practices. A number of recipes specifically for geospatial visualization, analytics, and data preparation are also covered. Last but not least, you'll learn about the power of storytelling through the creation of interactive dashboards in Tableau. Through this Learning Path, you will gain confidence and competence to analyze and communicate data and insights more efficiently and effectively by creating compelling interactive charts, dashboards, and stories in Tableau. This Learning Path includes content from the following Packt products: • Learning Tableau 10 - Second Edition by Joshua N. Milligan • Getting Started with Tableau 2018.x by Tristan Guillevin
Table of Contents (20 chapters)
Title Page
About Packt
Contributors
Preface
8
Deeper Analysis - Trends, Clustering, Distributions, and Forecasting
Index

Designing for different displays and devices


When designing a dashboard, some of the first questions you'll often ask yourself are: How will my audience view this dashboard? What kind of device will they use? With the wide adoption of mobile devices, this question becomes very important because what looks great on a large flat screen monitor doesn't always look great on a tablet or phone.

Previous versions of Tableau have given you the ability to set sizes for dashboards, but Tableau 10 gives you even greater flexibility by allowing you to define layouts for different devices.

The top of the Dashboard tab on the left sidebar reveals a button to preview the dashboard on various devices as well as a drop-down menu for Size options.

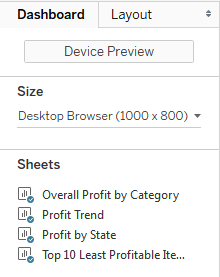
Clicking the Device Preview button not only allows you to see how your dashboard will look with various device types (and even specific models), but also allows you to add a layout for each device type that you can customize:

You can not only see how your dashboard...