

Various Joins in Tableau
Quite often, the data that you're using will be stored as separate tables for efficiency purposes. There might be some fields that are common between tables and can be used to join the data sources together.
For example, suppose you, as a bank loan manager, would like to evaluate the best-suited customer profiles for granting a loan. Here, based on the customer-provided information, such as salary details and work experience, you would also need to access their financial history information, such as previous loans, outstanding loans, or any defaults. This kind of information can be fetched from their Experian score using the customer PAN as common information between the various data sources. This is how joins are commonly used in a lot of daily scenarios. You will learn about these joins and the different types in Tableau.
Different Types of Joins
Tableau offers four types of joins, which are listed as follows:
- Inner: In an inner join between two tables, you can combine only the values that match among the two tables into the resulting table. For example, consider the following tables. When you join table A and table B using an inner join, only the common values will be a part of the resulting table:
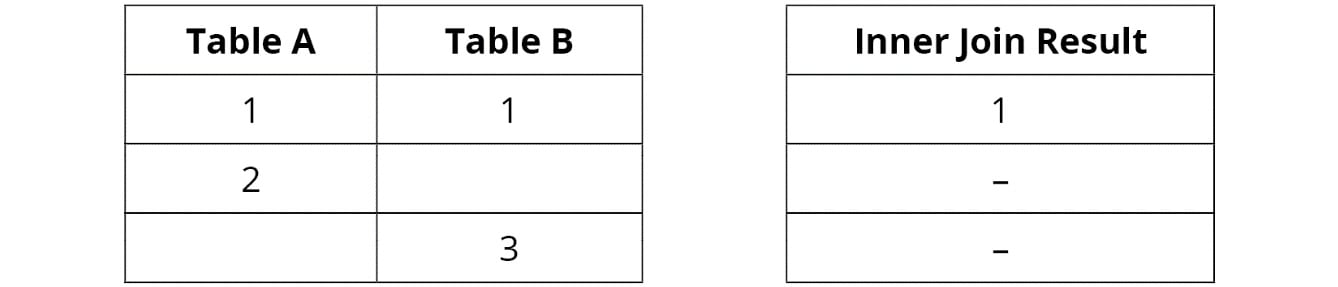
Figure 2.9: Inner Join Between Tables A and B
- Left: A left join combines all the values from the left table along with only the matching values from the right table. If there are no matching values, those rows will contain null values in the resulting table. In the following example, when you join table A and table B using a left join, all the values from table A and only the common values of table B will be a part of the resulting table:
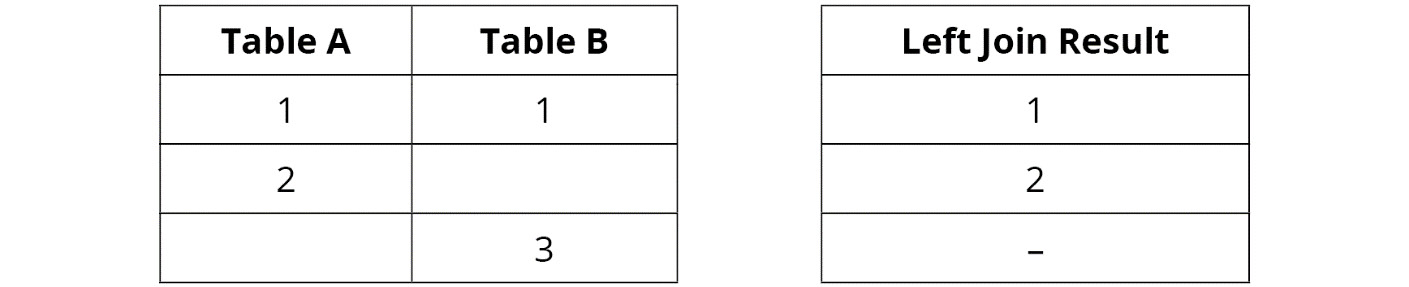
Figure 2.10: Left Join Between Tables A and B
- Right: This is the opposite of the left join. A right join combines all the values from the right table along with only the matching values from the left table. If there are no matching values, those rows will contain null values in the resulting table. Consider the following tables. When you join table A and table B using a right join, all the values from table B and only the common value from table A will be part of the resulting table:
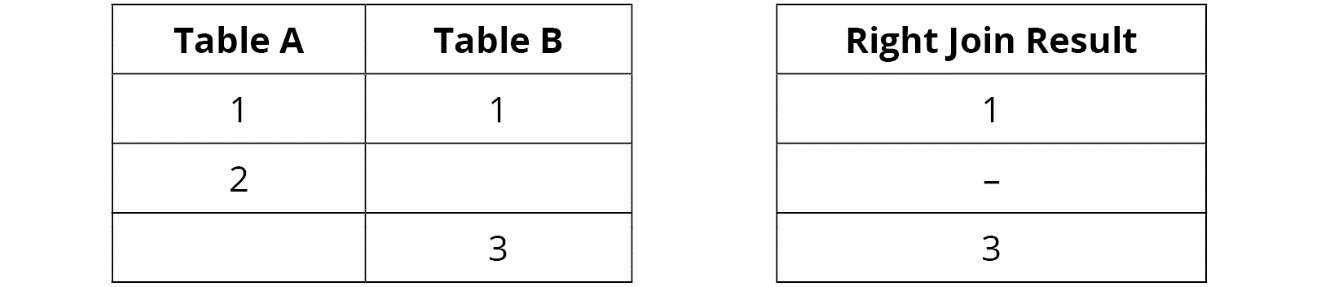
Figure 2.11: Right Join Between Tables A and B
- Full outer: In a full outer join between two tables, you can combine all the values from the left and right tables into one resulting table. If values don't match in any of the tables, those rows will contain null values in the resulting table.
Consider the following tables. Here, when you join table A and table B using an inner join, only the common values will be a part of the resulting table:
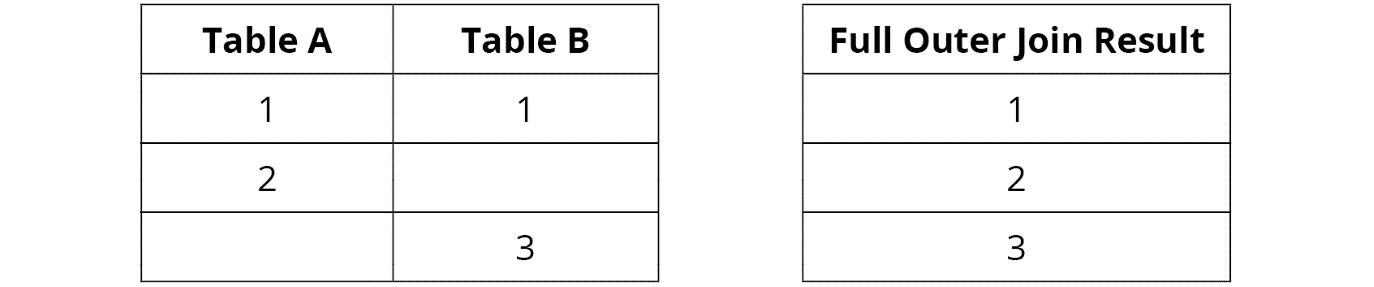
Figure 2.12: Full Outer Join Between Tables A and B
- Union: In a union, you combine two or more tables with similar column structures into a single resulting table. Union is performed when instead of joining you just want to append the data below other data with similar columns. A very common example of union is when you have two tables containing similar columns but maintained separately in different years, for example, combining order information for multiple years into a consolidated dataset.
- Consider the following tables, for example. Here, when you create a union of tables A and A1, you get a single table that will contain values for both A and A1:
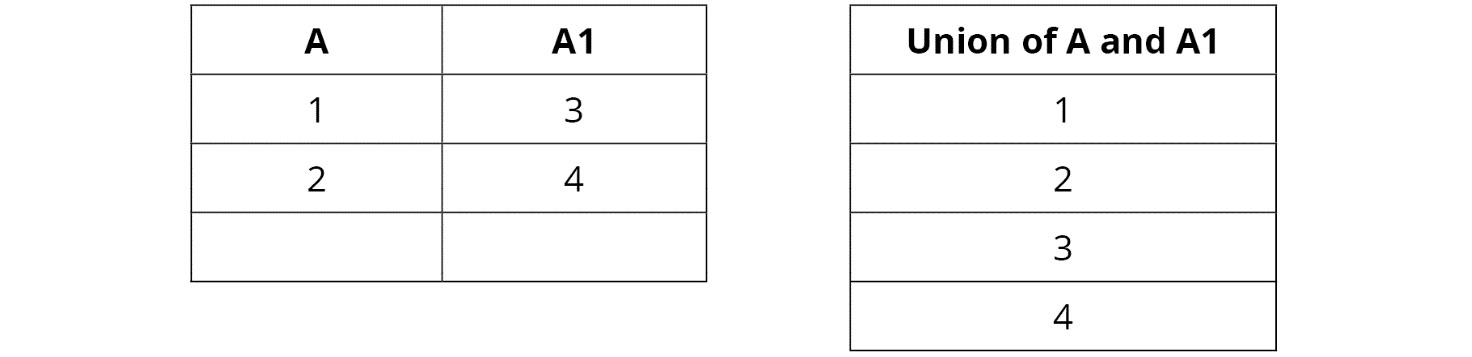
Figure 2.13: Union Between Tables A and B
You will learn more about these join types in detail in the following exercises.
Exercise 2.02: Creating an Inner Join Dataset
As an analyst, you might come across scenarios in which you need to display the common records between two tables. This exercise aims to show how to join two different sheets into a single data source in Tableau.
You will join the Orders table with the People table using an inner join. By doing so, you will be able to identify the customer records present in the People table along with the order information from the Orders table, which will help you to understand customers' buying preferences.
Perform the following steps to complete this exercise:
- Load the
Sample – Superstoredataset into your Tableau instance as you did in Exercise 2.01. - Drag the
Orderstable first, followed by thePeopletable, from theSheetsarea to theDrag Sheets herearea. Alternatively, to add these sheets, you can double-click on them, and they will be added automatically to the canvas area. Tableau will auto-join the two tables using an inner join, as shown in the following figure:
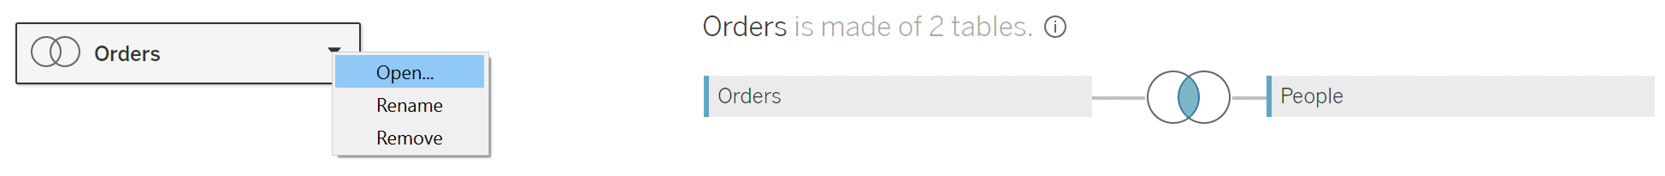
Figure 2.14: Data joining using an inner join
- Click on the
Joinsymbol to open theJoinmenu:
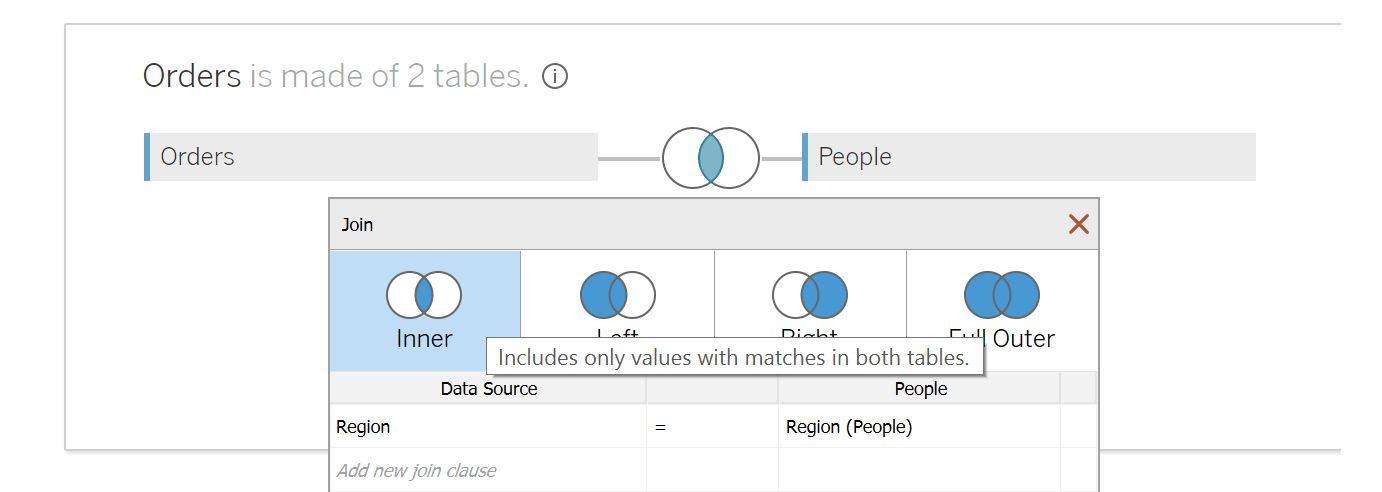
Figure 2.15: Inner join properties
Note the various ways to join data. By default, Tableau performs an inner join on the common field names:

Figure 2.16: Various join options
Note
These instructions and images are based on Tableau version 2020.1. If you are using a later version of Tableau, such as 2021.4, this process may look quite different and even require an extra step. You can find additional guidance for this at the following URL: https://help.tableau.com/v2021.4/pro/desktop/en-gb/datasource_relationships_learnmorepage.htm
- If there are no common names, select the columns manually to enable the join. Since you are joining the
OrdersandPeopletables, join onCustomer NamefromOrdersandPersonfromPeople. First, de-selectRegion, which is auto-selected by Tableau. To do this, click onRegionand selectCustomer Namefrom the dropdown, as you can see in the following figure:
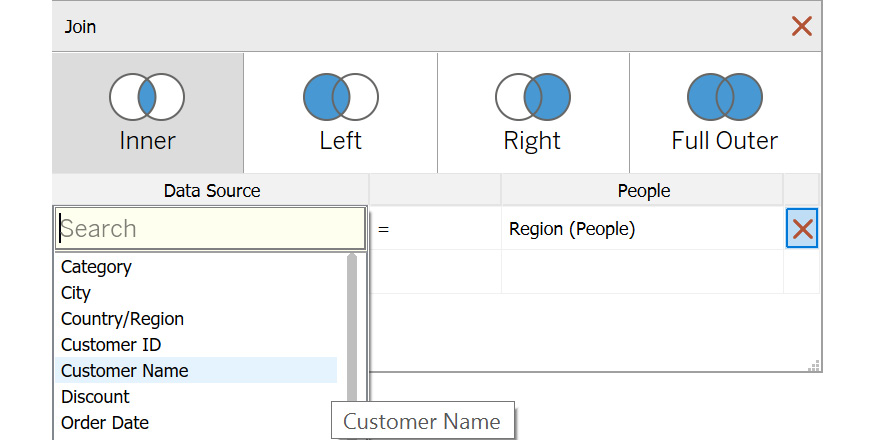
Figure 2.17: Changing the join column
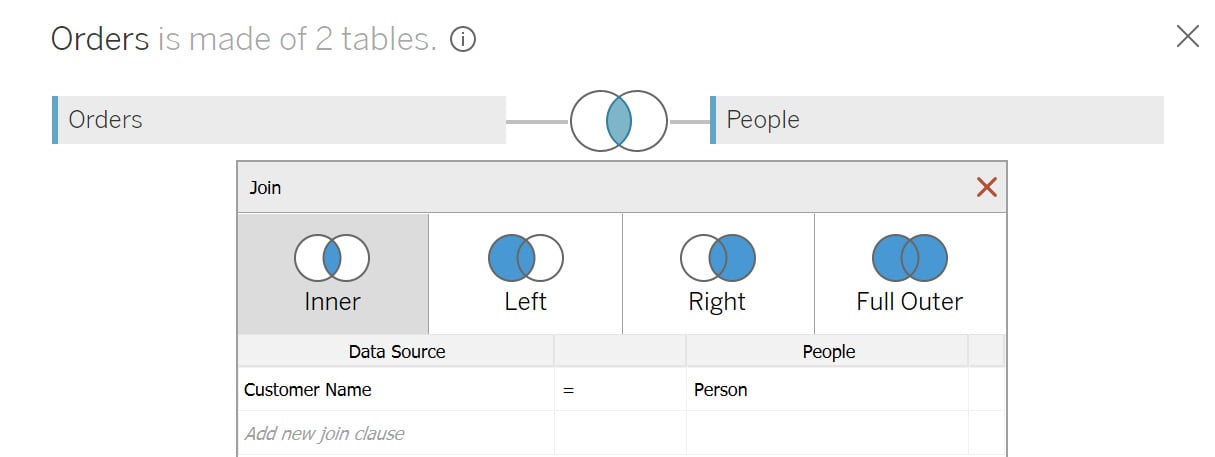
Figure 2.18: Final result of the inner join
- Repeat the same for the
Peopletable and selectPersonas the joining column. Your joined columns should be as follows:
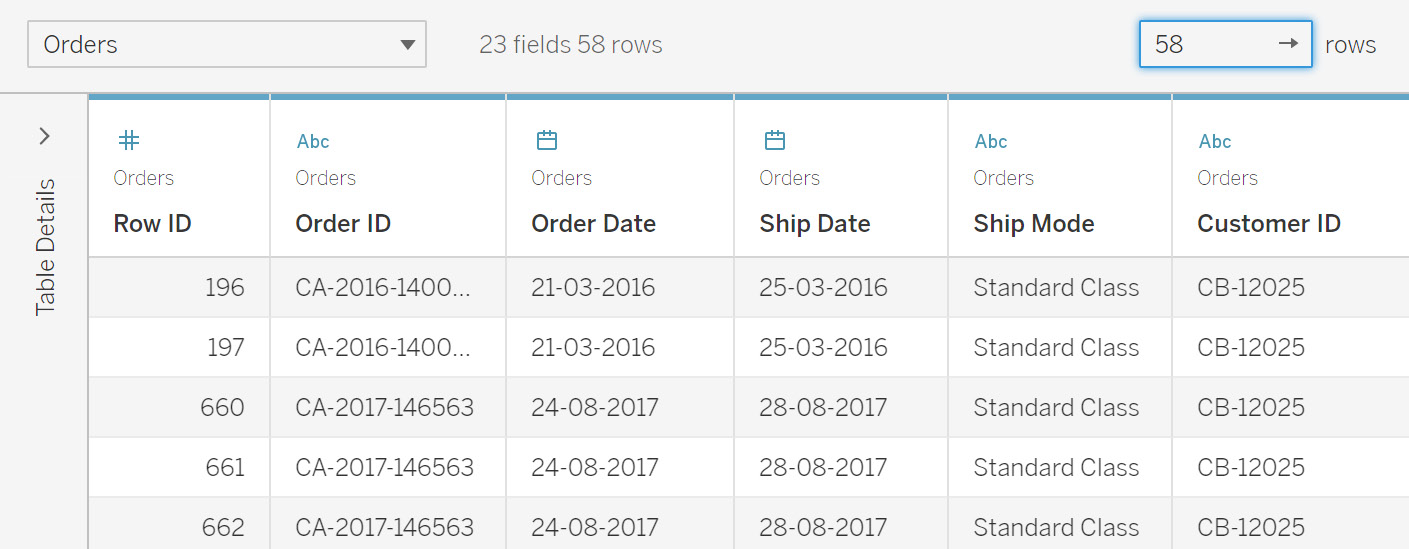
Figure 2.19: Data preview of the Order and People tables
Now it's time to validate the results. This can be observed in the data grid screen in the bottom section.
You can see that you get only 58 rows in the joined dataset. Here, only the values from the Orders table's Customer Name column that match with values from the People table's Person column will be returned in the final dataset. Since the Person table has only four values, only those values from the Customer Name column that match these four are returned from the Orders table.
In this exercise, you used inner join and analyzed the results returned by using this join type. Next, you will learn about the left join type.
Exercise 2.03: Creating a Left Join Dataset
In this exercise, you will join the Orders table with the People table in a left join. The objective of the left join is to verify how much customer information is present in the People table. This will help identify and update the People table so that you can expand the customer database, to drive better sales:
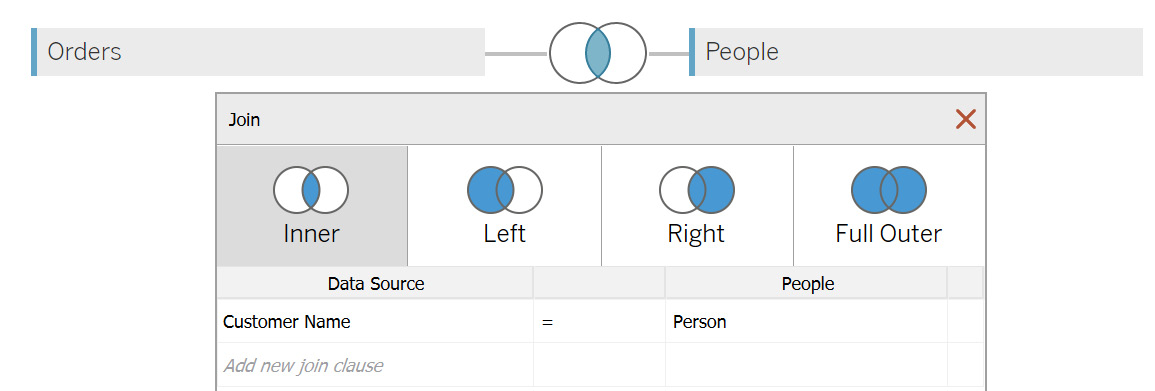
Figure 2.20: Join screen for the Orders and People tables
- Repeat the same step from the previous exercise of dragging the
OrdersandPeopletables to the canvas. Once done, you should see the join options, as follows: - Change the join type to
Left:
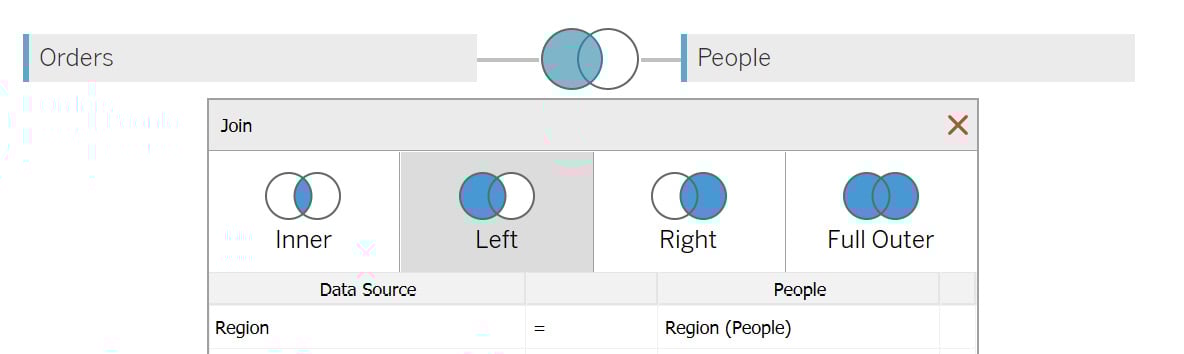
Figure 2.21: Selecting the Left join
- Now, in the data preview (as shown in the following figure), scroll toward the right side. You will see two columns from the
Peopletable,PersonandRegion. Use theSorticon to sort the values, as highlighted in the following figure:
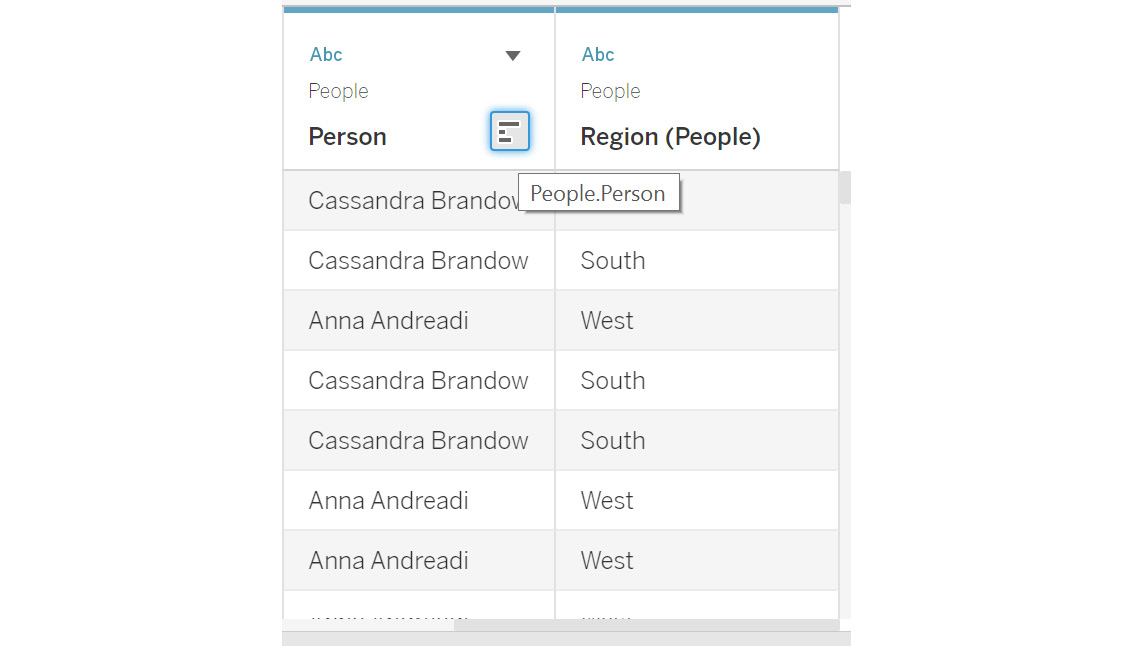
Figure 2.22: Analyzing the left join results
- Scroll down to see what happens if the
Customernames do not match any values in thePersoncolumn.
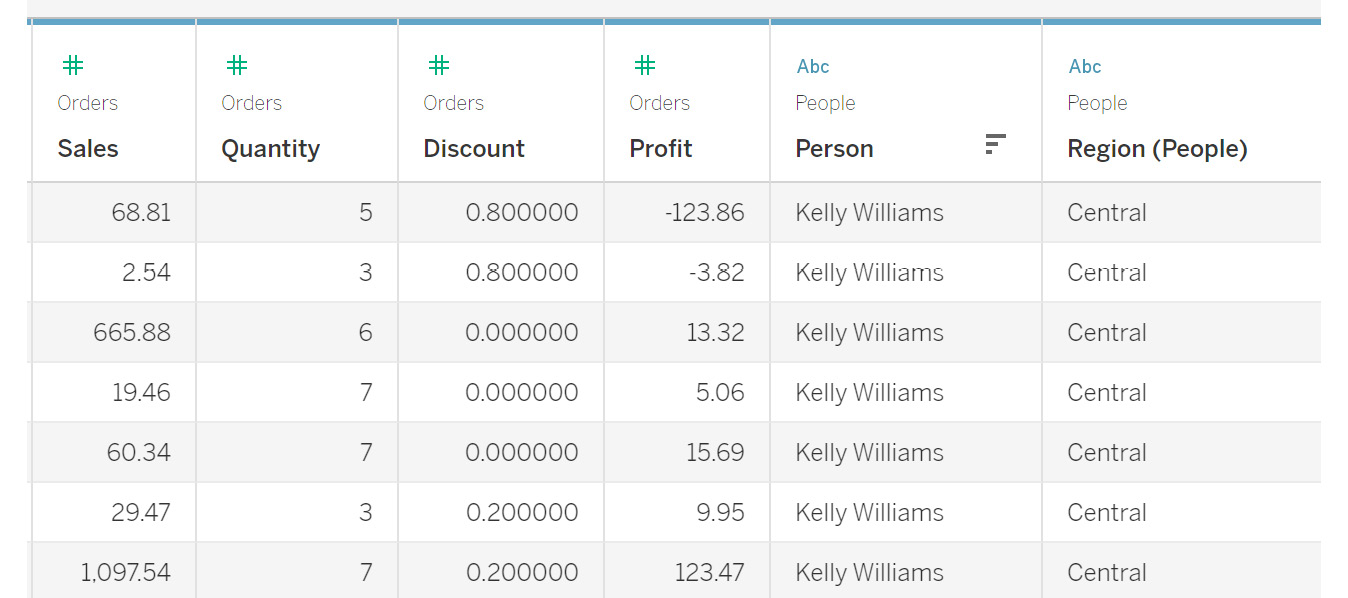
Figure 2.23: Nulls in the join result
You will observe that the rows where a match is not found are replaced by a null value, which means the Person table does not contain information for these customers. This means that you can add this customer information to the People table to improve the data quality.
In this exercise, you learned how to perform a left join and how data is matched between the two tables. Next, you will learn about the right join type.
Exercise 2.04: Creating a Right Join Dataset
In this exercise, you will join the Orders table with the People table in a right join. Consider a scenario wherein the People table consists of all the customers who have previously bought your company's products, and you want to fetch a complete list of the products a customer has bought, using information from the Orders table. This will help you understand the buying habits of customers based on their past purchases.
The steps to complete this exercise are as follows:
- Drag the
OrdersandPeopletables similar to how you did in the previous exercises so that you can see the following on your screen:
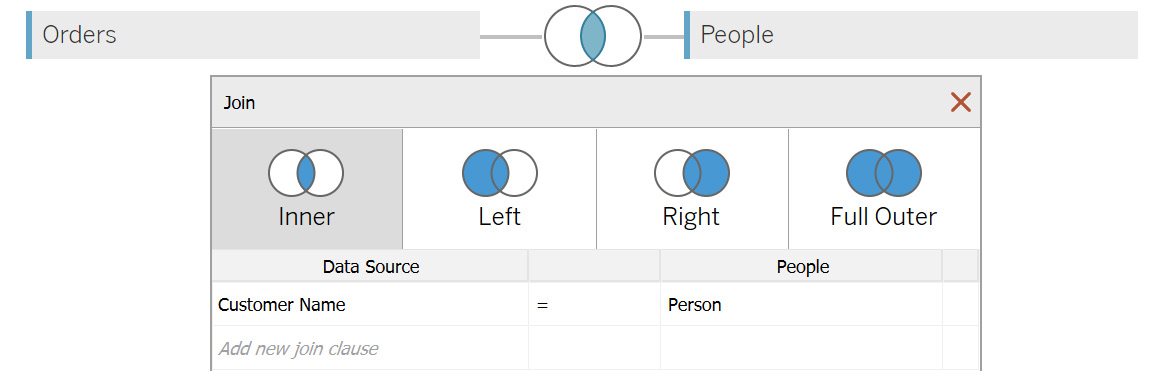
Figure 2.24: Join screen for the Orders and People tables
- Select the
Rightjoin, as shown in the following figure:
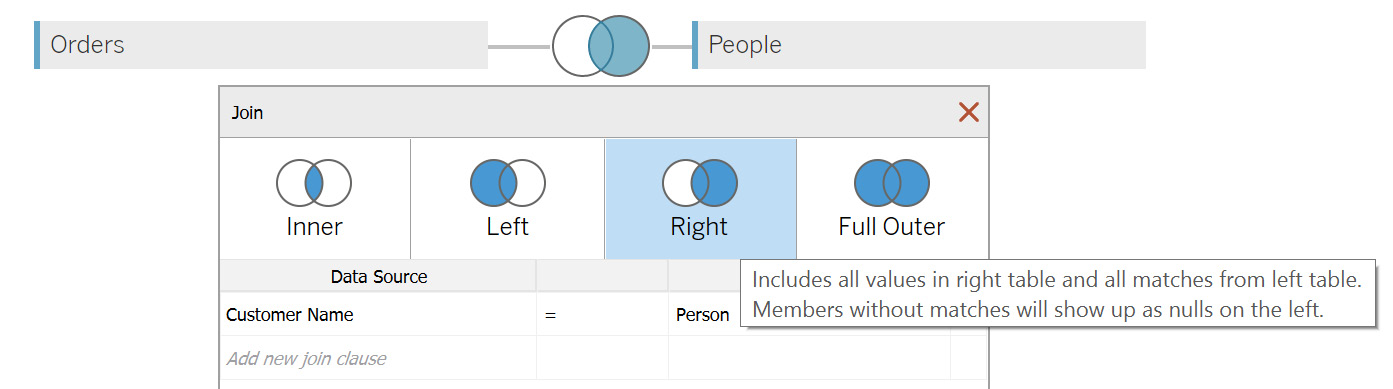
Figure 2.25: Selecting the Right join
- Now, in the data preview, scroll toward the right side. You will see the
PersonandRegioncolumns from thePeopletable. Use theSorticon to sort the values, as highlighted in the following figure: 
Figure 2.26: Analyzing the right join results
You will observe that the rows from the People table contain information about customers with past orders. This can now help you to analyze what products a person tends to buy often, and accordingly, you can suggest similar products to them, for a better-targeted sales strategy.
In this exercise, you performed a right join on two tables and saw how to use the right join results to analyze data. Next, you will learn about a full outer join.
A full outer join would combine the results of both the joining tables into a single dataset. To do that in Tableau, you can use the join properties and change the join type to Full Outer.
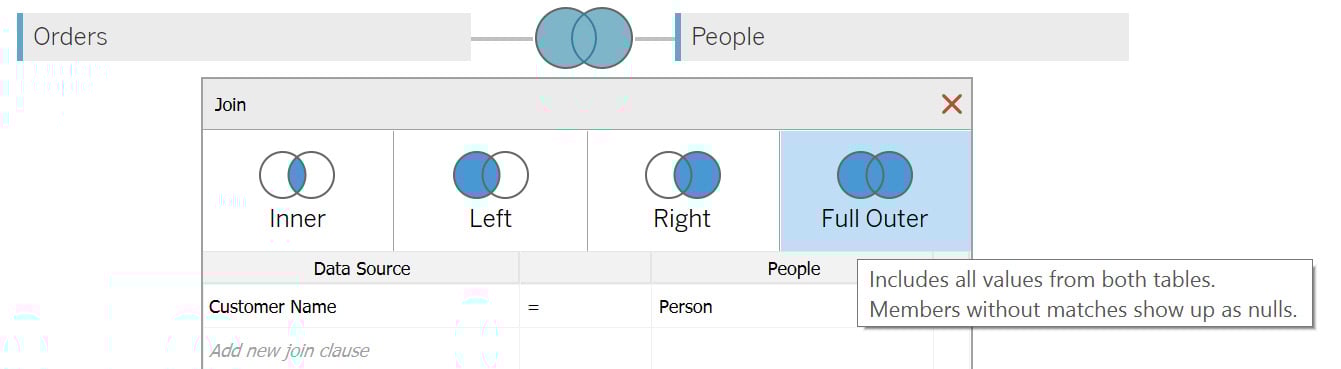
Figure 2.27: Selecting the Full Outer join
The next thing to cover is the union operation. In a union, the new table will be appended below the previous table in the final dataset. Usually, unions are used when you want to combine datasets with a common structure of columns. For example, order information for 2021 can be combined using a union with the order information for 2020 to get a unified dataset.
In the next exercise, you will learn how to implement a union in Tableau.
Exercise 2.05: Creating a Combined Dataset Using Union
Consider a scenario related to a large retailer such as Walmart or Amazon, operating in multiple regions. In such a case, it makes more sense to store the data at the regional level so that it can contain products customized to that specific region. If you were to compare how the different regions perform among each other, you would need to combine these different data sources into one. This is where the concept of a union comes into play.
In this exercise, you will use the Orders table, which is split by region. The files for different regions follow a similar column structure as the Orders table but are segregated into different sheets based on their regions, as you can see from the following figure:

Figure 2.28: Input data for the Orders table preview stored as different tabs
You have the data for two regions: Central and West. You can implement a union to combine these two regions into a single dataset, as outlined in the following steps:
- Save the files on your local machine. Load the
UnionExcel file using theConnectoption from the location where the files are saved, as done for the previous exercises. Once the file is imported, you should see the following screen:
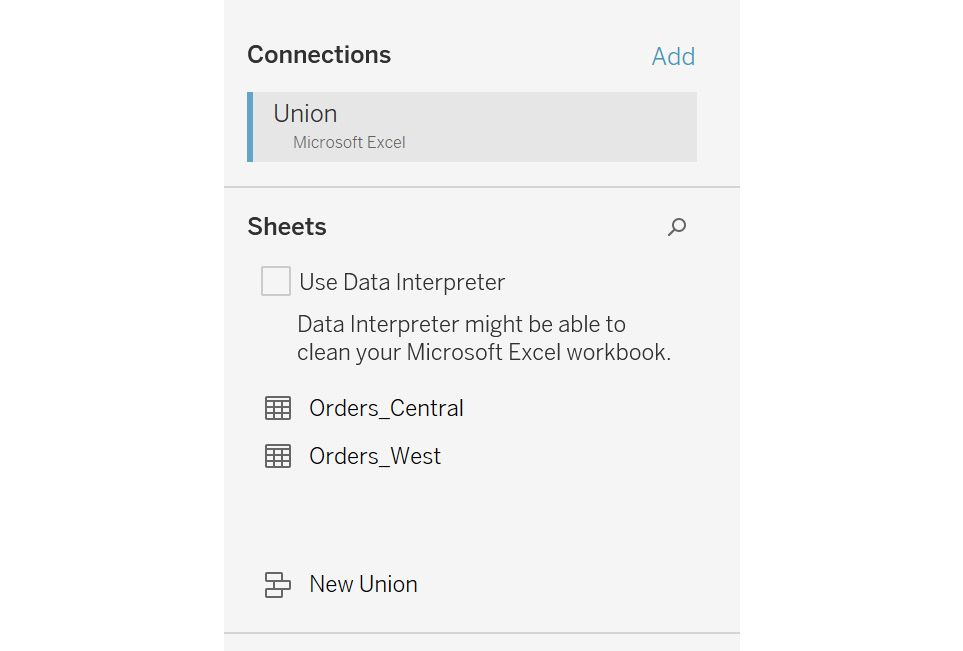
Figure 2.29: Orders table for the Central and West regions
- Double-click on the
New Unionoption to open theUnionpopup, as shown in the following figure:
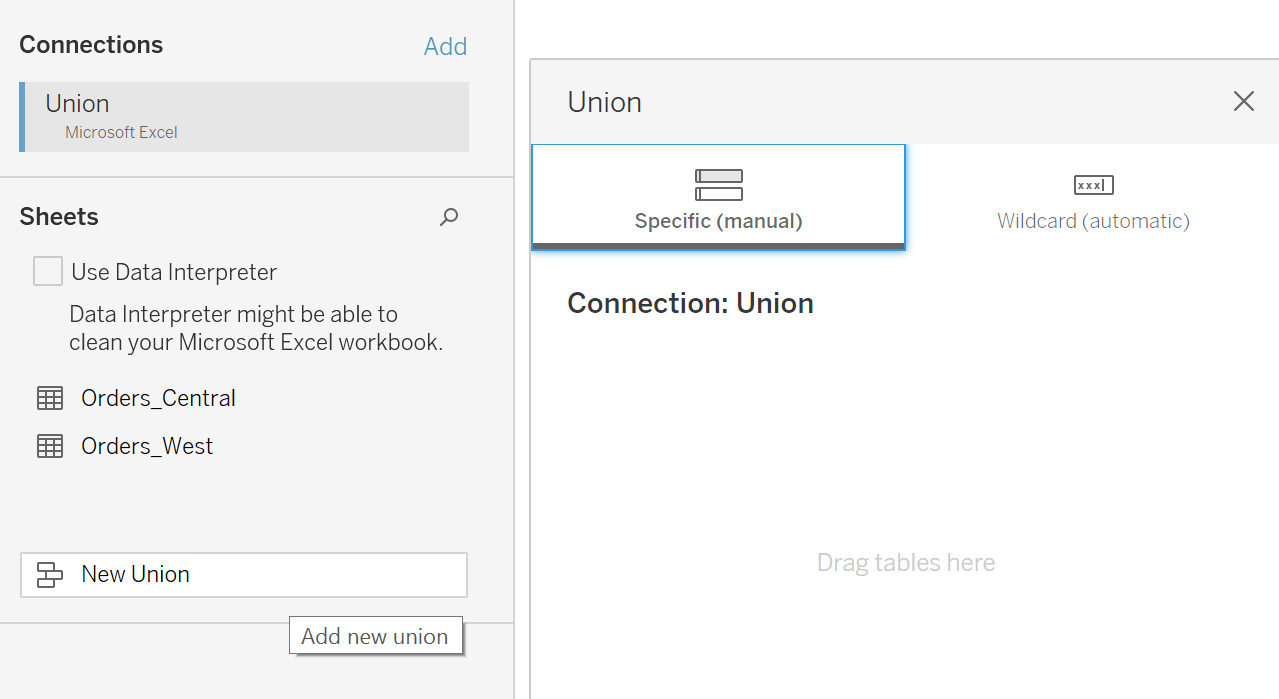
Figure 2.30: New Union popup
- Drag the two order tables onto the
Unionpopup, as follows:
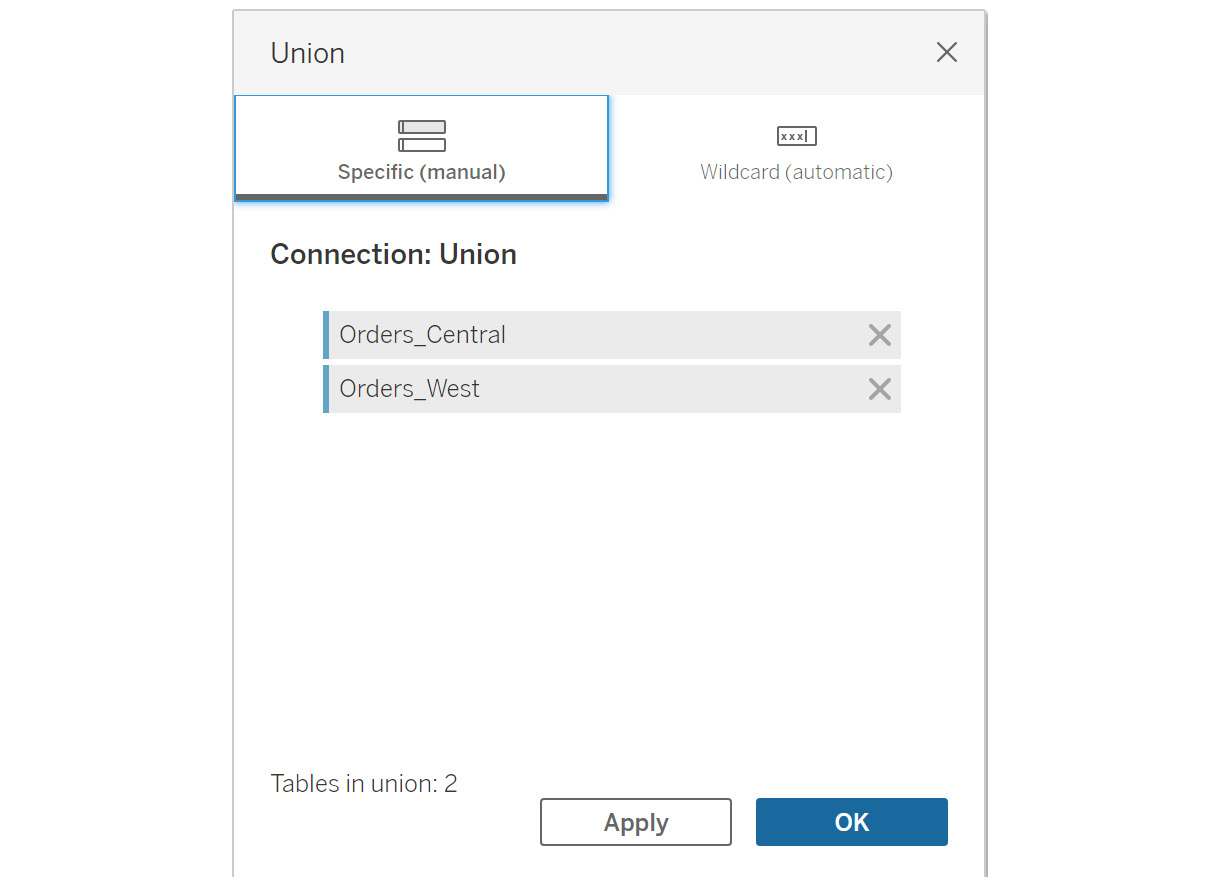
Figure 2.31: Adding tables in a union
- Click on
OKto add the union to the data grid.
You can now preview the data in the bottom section. Tableau will combine the data from both tables into a single data source.
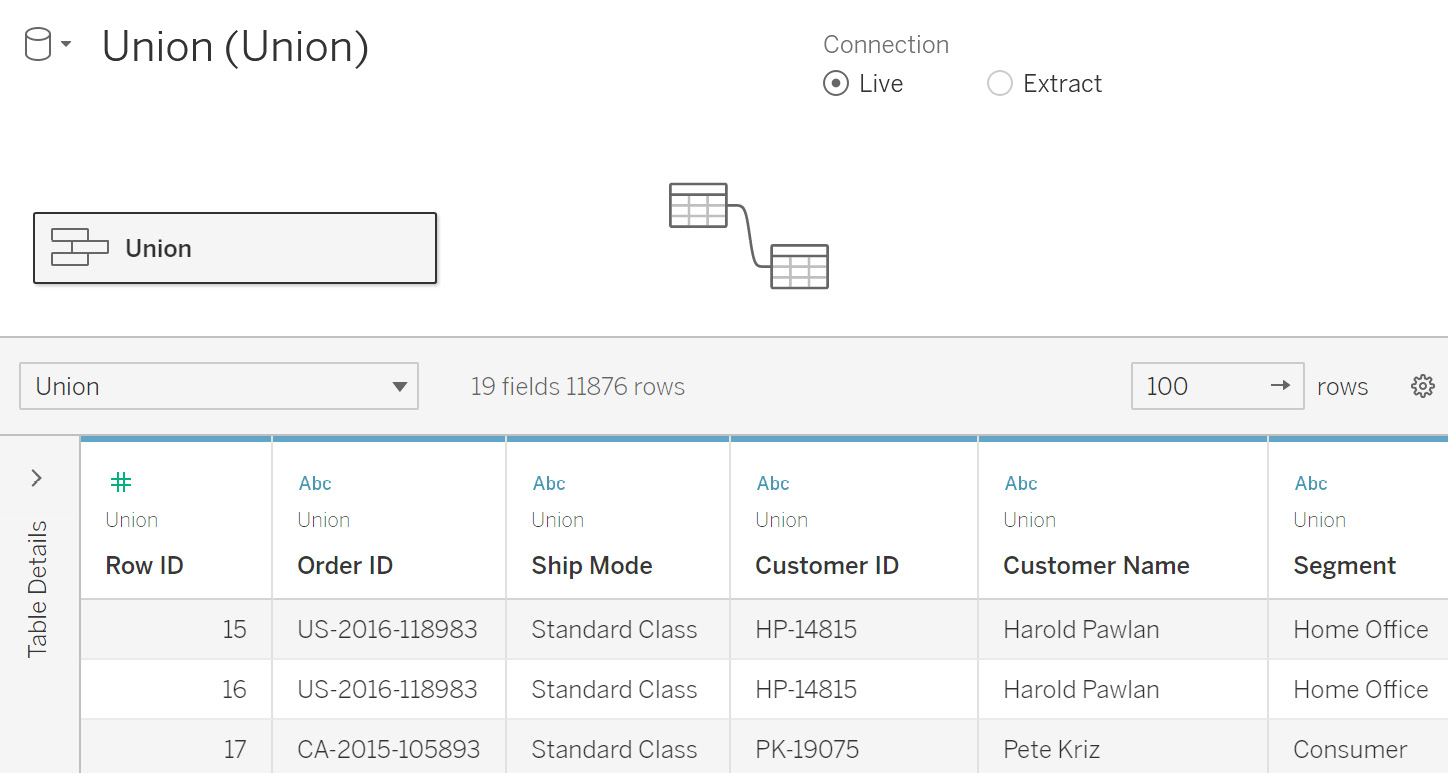
Figure 2.32: Union data preview
- Scroll to the right side of the data preview. You will see two additional columns—namely
SheetandTable Name.Sheetsignifies which Excel file sheet this data belongs to andTable Namerefers to the table names in Tableau. This can be used to quickly identify which columns come from which sheets and tables.
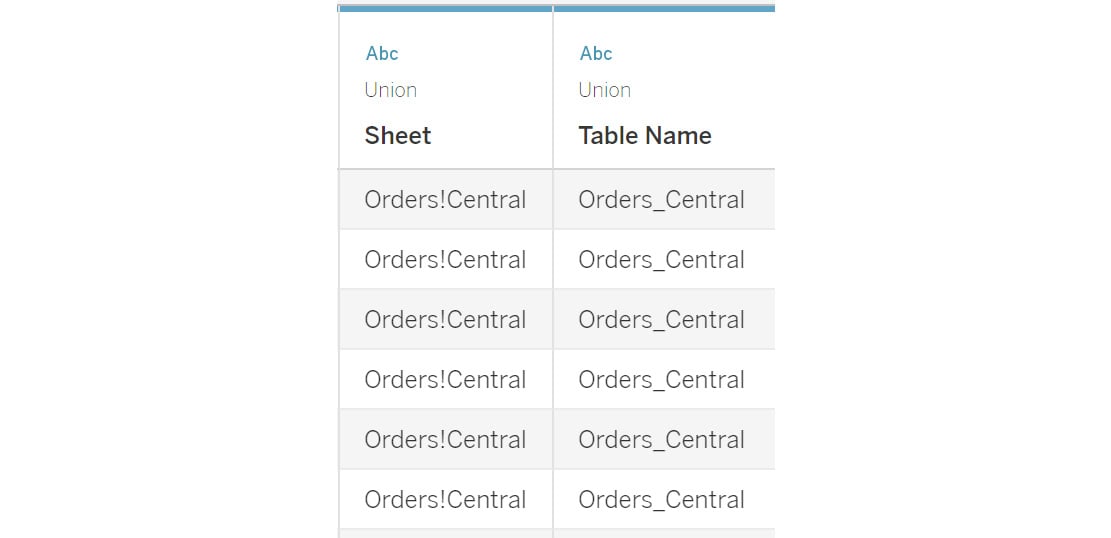
Figure 2.33: Table identification columns in the union result
In this exercise, you learned how to perform a union of multiple data sources.
In all the preceding exercises, you joined on only two data sources. It is possible to add more than two data sources. You will just need to specify in the join connection how the tables join to each other.
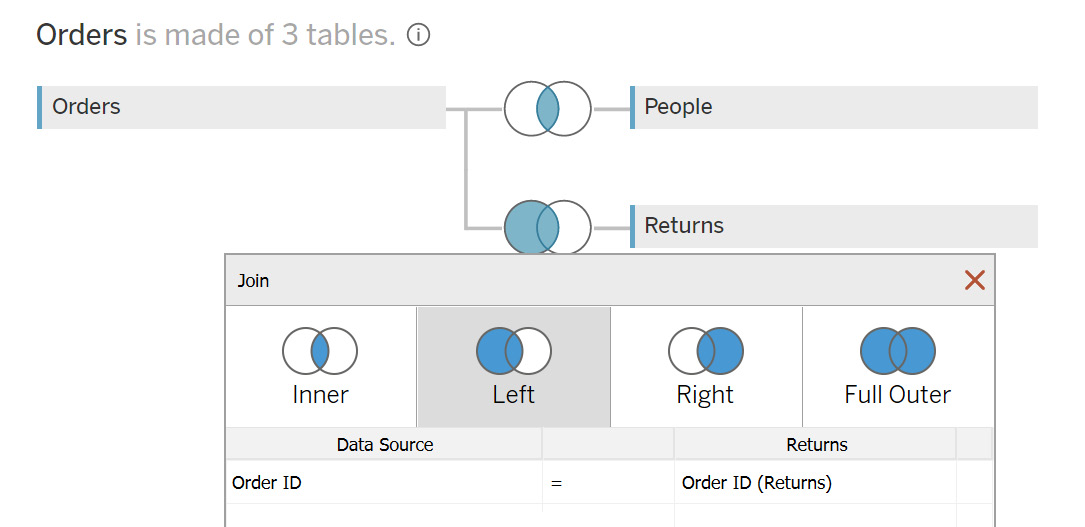
Figure 2.34: Joining with more than two tables
The preceding figure shows an example join on the Orders table with the People and Returns tables. If there were a common field between the Returns and People tables, you could also join these two tables as per your requirements.
This completes the various ways you can join multiple tables in Tableau and concludes the discussion on the various ways to combine data from multiple sources together. The following sections will deal with preparing your data for your desired task.