-
Book Overview & Buying
-
Table Of Contents

The Data Visualization Workshop
By :
The Data Visualization Workshop
By:
Overview of this book
Do you want to transform data into captivating images? Do you want to make it easy for your audience to process and understand the patterns, trends, and relationships hidden within your data?
The Data Visualization Workshop will guide you through the world of data visualization and help you to unlock simple secrets for transforming data into meaningful visuals with the help of exciting exercises and activities.
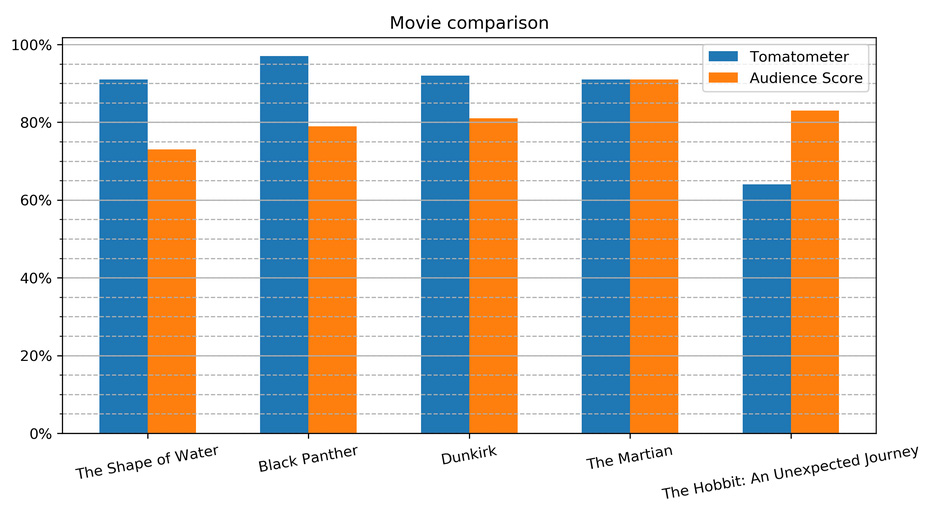
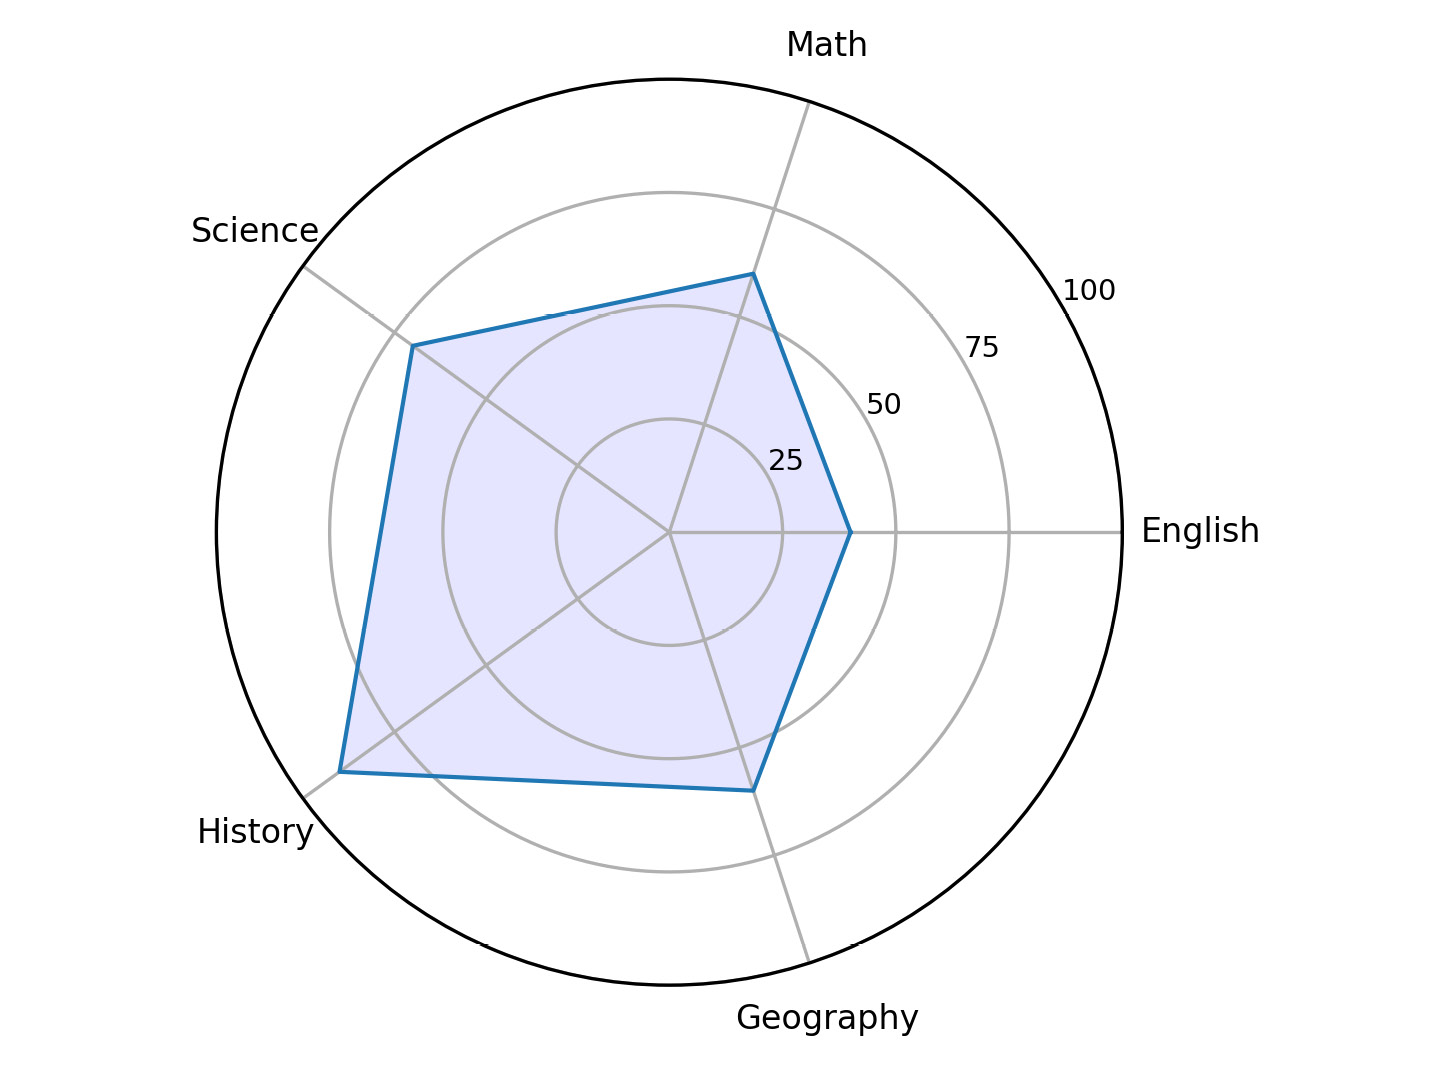
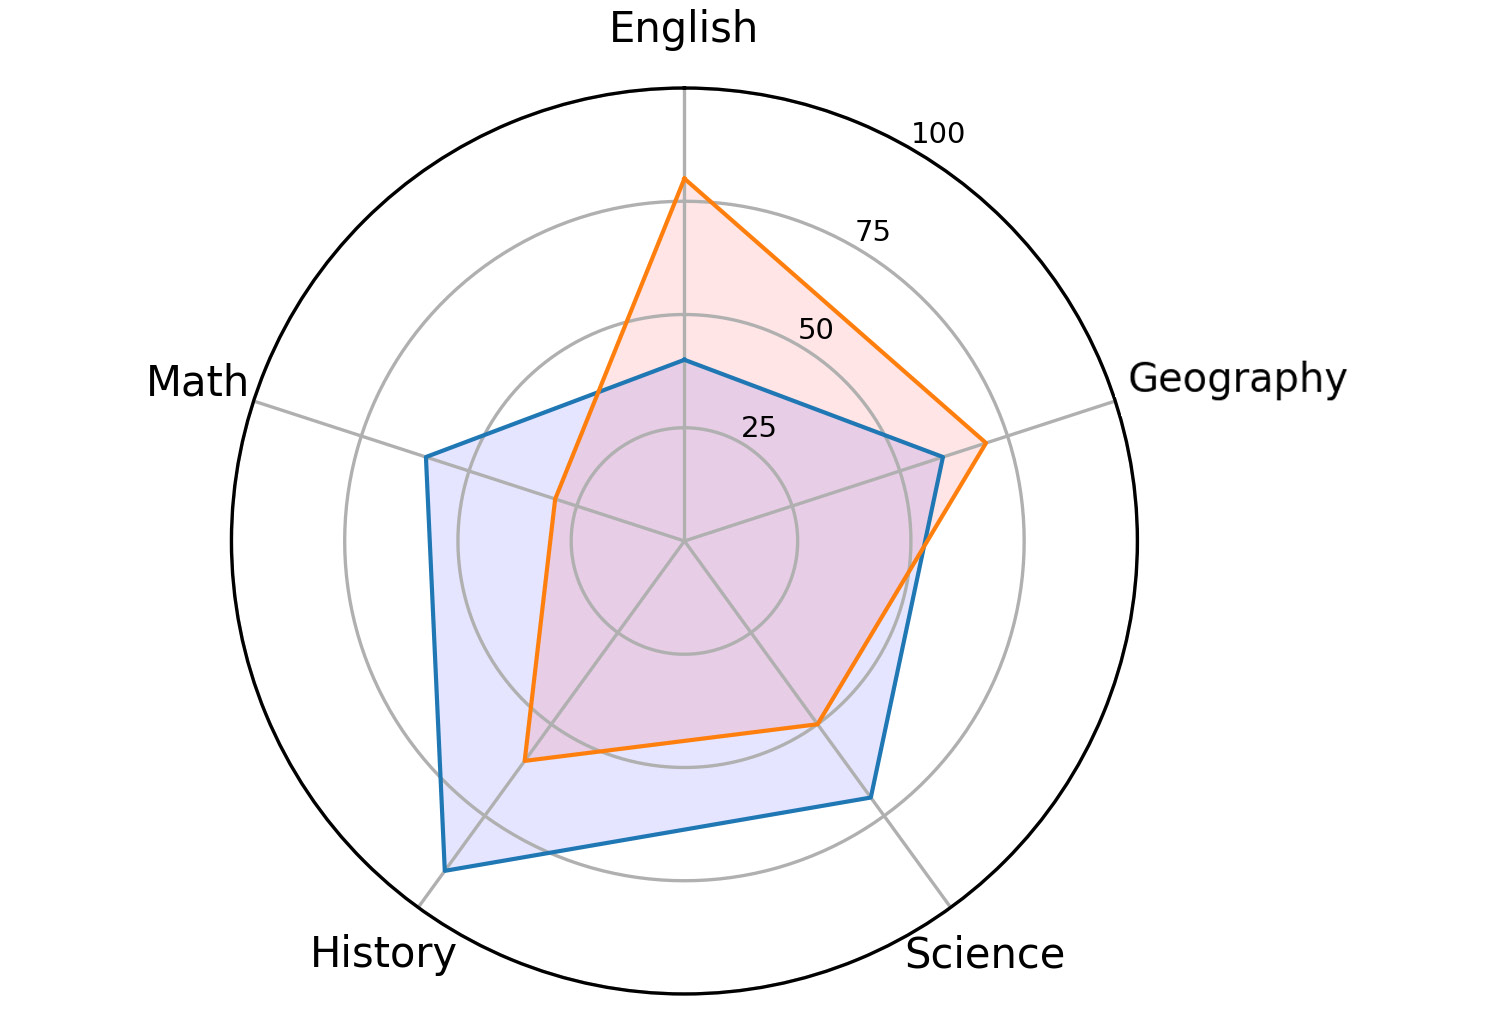
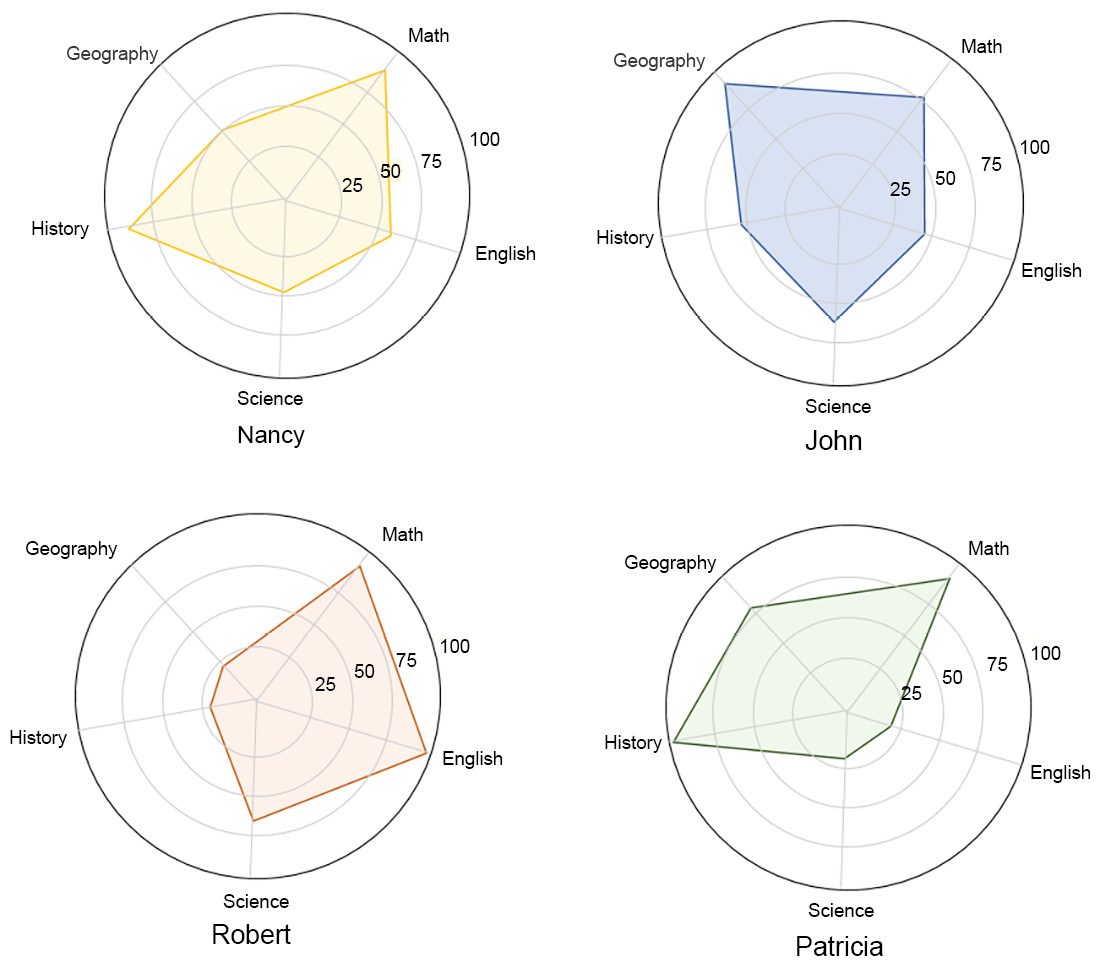
Starting with an introduction to data visualization, this book shows you how to first prepare raw data for visualization using NumPy and pandas operations. As you progress, you’ll use plotting techniques, such as comparison and distribution, to identify relationships and similarities between datasets. You’ll then work through practical exercises to simplify the process of creating visualizations using Python plotting libraries such as Matplotlib and Seaborn. If you’ve ever wondered how popular companies like Uber and Airbnb use geoplotlib for geographical visualizations, this book has got you covered, helping you analyze and understand the process effectively. Finally, you’ll use the Bokeh library to create dynamic visualizations that can be integrated into any web page.
By the end of this workshop, you’ll have learned how to present engaging mission-critical insights by creating impactful visualizations with real-world data.
Table of Contents (9 chapters)
Preface

1. The Importance of Data Visualization and Data Exploration
 Free Chapter
2. All You Need to Know about Plots
3. A Deep Dive into Matplotlib
4. Simplifying Visualizations Using Seaborn
5. Plotting Geospatial Data
6. Making Things Interactive with Bokeh
7. Combining What We Have Learned