

Incorporating the new URL interactivity into the app
Having created a dropdown that automatically changes the URL based on the selected value, we have allowed our users to go from page to page as they please. We now need to manage the display of the right content based on the selected country.
Since the code was already written, one thing you can do is run the app in debug mode and get a visual representation of all the available components and see how they are connected with callbacks.
Figure 11.5 shows the graph of the callbacks that have been created. Let's use it to understand how this functionality was implemented:
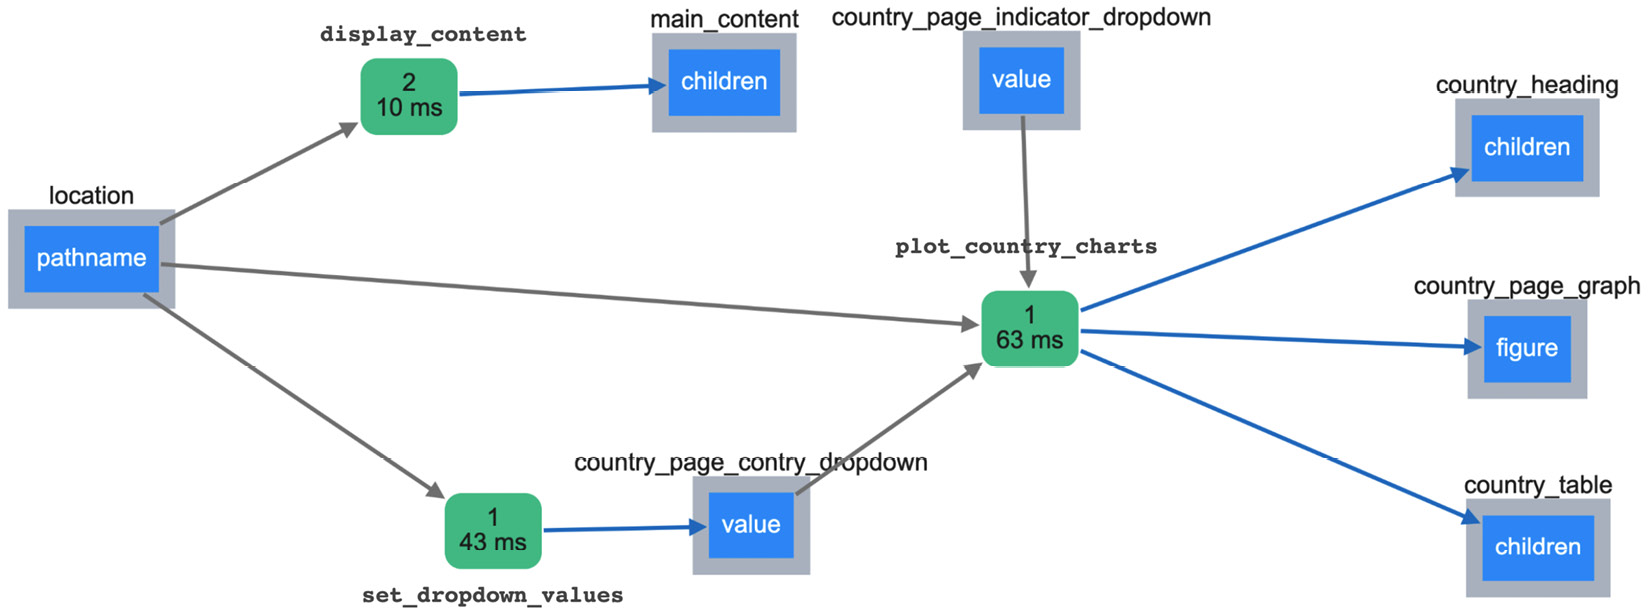
Figure 11.5 – The various components and callbacks managing the URL functionality
Let's go through the figure from left to right and see what is going on here. You can refer to Figure 11.2 to see how this graph corresponds to visible components in the app:
- Everything starts with the pathname attribute of...