Book Image

Time Series Analysis with Python Cookbook

By : Tarek A. Atwan
Book Image

Time Series Analysis with Python Cookbook

By: Tarek A. Atwan

Overview of this book

Time series data is everywhere, available at a high frequency and volume. It is complex and can contain noise, irregularities, and multiple patterns, making it crucial to be well-versed with the techniques covered in this book for data preparation, analysis, and forecasting. This book covers practical techniques for working with time series data, starting with ingesting time series data from various sources and formats, whether in private cloud storage, relational databases, non-relational databases, or specialized time series databases such as InfluxDB. Next, you’ll learn strategies for handling missing data, dealing with time zones and custom business days, and detecting anomalies using intuitive statistical methods, followed by more advanced unsupervised ML models. The book will also explore forecasting using classical statistical models such as Holt-Winters, SARIMA, and VAR. The recipes will present practical techniques for handling non-stationary data, using power transforms, ACF and PACF plots, and decomposing time series data with multiple seasonal patterns. Later, you’ll work with ML and DL models using TensorFlow and PyTorch. Finally, you’ll learn how to evaluate, compare, optimize models, and more using the recipes covered in the book.
Table of Contents (18 chapters)

Decomposing time series with multiple seasonal patterns using MSTL

The Decomposing time series data recipe in Chapter 9, Exploratory Data Analysis and Diagnosis, introduced the concept of time series decomposition. In those examples, the time series had one seasonal pattern, and you were able to decompose it into three main parts – trend, seasonal pattern, and residual (remainder). In the recipe, you explored the seasonal_decompose function and the STL class (Seasonal-Trend decomposition using Loess) from statsmodels. Recall, in an additive model, your time series is reconstructed by the following equation:

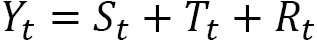
Here, represent the seasonal, trend, and remainder components at time respectively. But what about data with higher frequency – for example, IoT devices that can record data every minute or hour? Such data may exhibit multiple seasonal patterns.

Given the limitations of traditional seasonal decomposition approaches, a new approach for...