
Navigating and using DataRobot features
Now that you have some familiarity with the core functions, let's take a quick tour of what DataRobot looks like and how you navigate the various functions. This section will introduce DataRobot at a high level, but don't worry: we will get into details in subsequent chapters. This section is only meant to familiarize you with DataRobot functionality.
Your DataRobot administrator will provide you with the appropriate URL and a username and password to access your DataRobot instance. In my experience, Google Chrome seems to work best with DataRobot, but you can certainly try other browsers as you see fit.
Note
Please note that the screens and options you see depend on the products you have the license for and the privileges granted to you by your admin. For most part, it will not affect the flow of this book. Since we will be focusing on the ML development core of DataRobot, you should be able to follow along.
So, let's go ahead and launch the browser and go to your DataRobot URL. You will see a login screen as shown in the following figure:
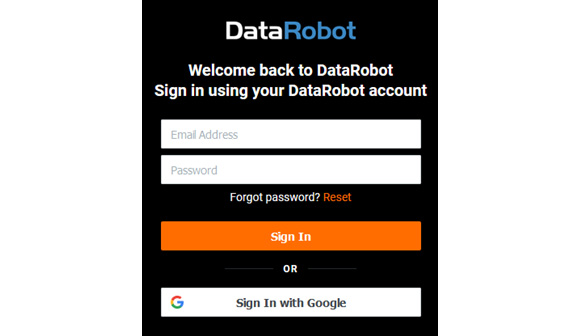
Figure 1.4 – DataRobot login screen
Go ahead and log in using your credentials. Once you have logged in, you will be presented with a welcome screen (Figure 1.4) that prompts you to select what you want to do next. It is also possible that (depending on your setup) you will be directly taken to the data input screen (Figure 1.5):
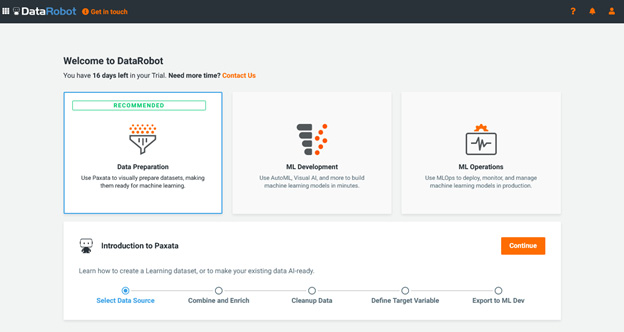
Figure 1.5 – Welcome screen
At this point, we will select the ML Development option and click the Continue button. This prompts you to provide the dataset that you wish to build models with (Figure 1.5):
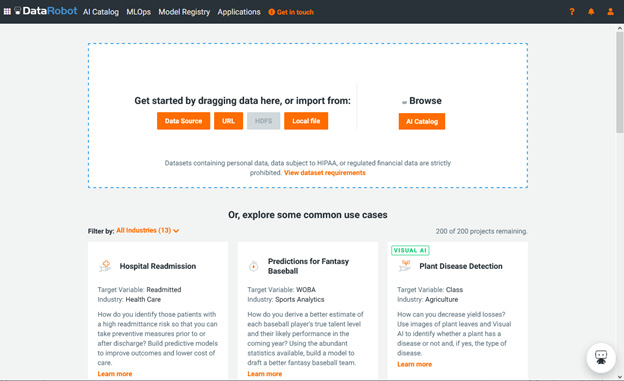
Figure 1.6 – New project/drag dataset screen
At this point, you can drag a dataset file from your local machine onto the screen (or select one of the other choices) and DataRobot will start the process of analyzing your data. You can click on the View dataset requirements link to see the file format options available (Figure 1.6). The file size requirements for your instance might be different from what you see here:
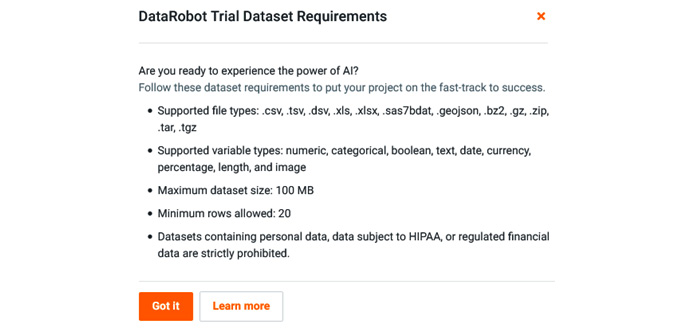
Figure 1.7 – Dataset requirements
At this point, you can upload any test dataset from your local drive. DataRobot will immediately start evaluating your data (Figure 1.7):
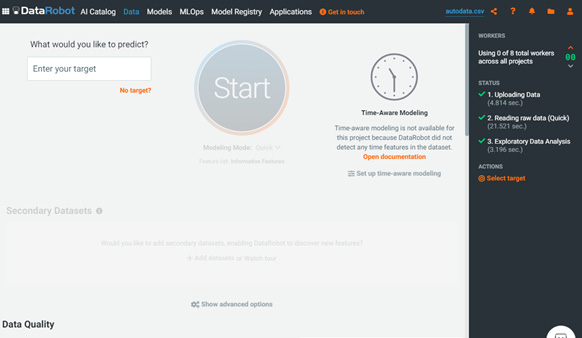
Figure 1.8 – EDA
We will cover the process of building the project and associated models in later chapters; for now, let's cover what other options we have. If you click on the ? icon in the top right, you will see the DOCUMENTATION drop-down menu (Figure 1.8):
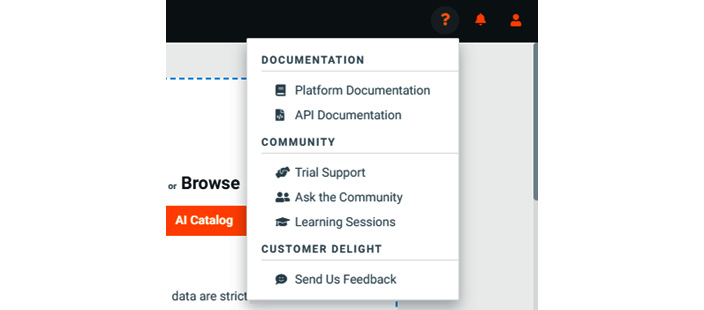
Figure 1.9 – DOCUMENTATION drop-down menu
Here you see various options to learn more about different functions, contact customer support, or interact with the DataRobot community. I highly recommend joining the community to interact with and learn from other community members. You can reach the community via https://community.datarobot.com. If you select Platform Documentation from the dropdown, you will see extensive documentation on DataRobot functions (Figure 1.9):
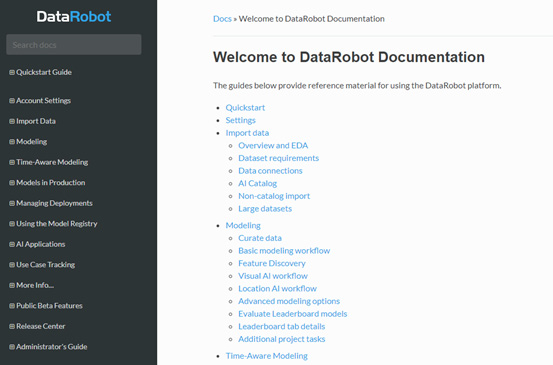
Figure 1.10 – DataRobot platform documentation
You can review the various topics at your leisure or come back to a specific topic as needed according to the task you are working on. Let's click on the ? icon in the top right again and this time select API Documentation from the dropdown. You will now see the documentation for the DataRobot API (Figure 1.10):
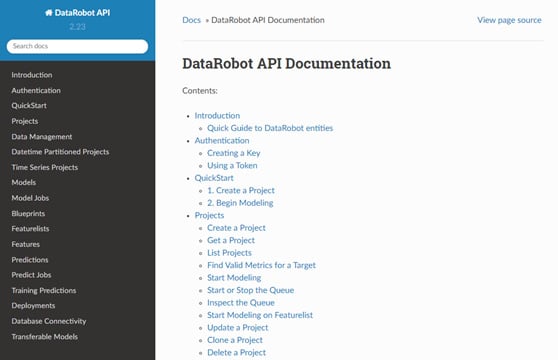
Figure 1.11 – DataRobot API Documentation
We will cover the API in the advanced topics in later chapters. If you are not familiar with programming or are relatively new to programming, you can ignore this part for now. If you are an experienced data scientist with expertise in Python or R, you can start reviewing the various functions available to you to automate your model-building tasks even further.
Let's go back to the main DataRobot page and this time select the folder icon in the top right of the page (Figure 1.11):
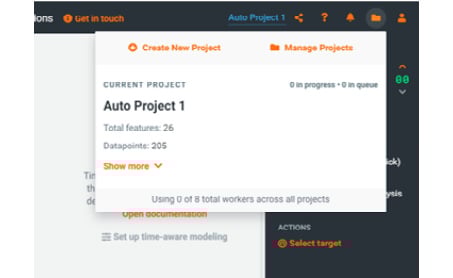
Figure 1.12 – Project drop-down menu
If you do not see the folder icon, it simply means that you do not have any projects defined. We will describe creating projects in more detail later. For now, just familiarize yourself with different options and what they look like. Here you will see options to create a new project or manage existing projects. In here, you will also see some details about the currently active project as well as a list of recent projects.
The Create New Project option takes you back to the new project page that we saw before in Figure 1.5. If you select the Manage Projects menu, it will show all of your projects listed by create date (Figure 1.12). Here you are able to select a project to see more details, clone a project, share the project with other users, or delete a project as needed, as shown in the following figure:
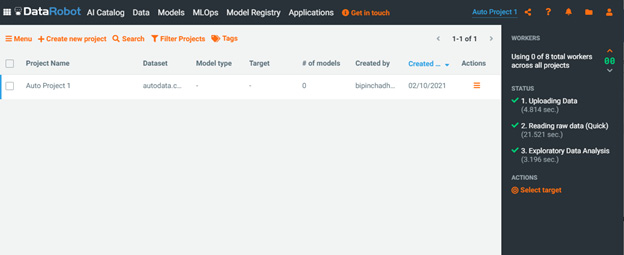
Figure 1.13 – Manage projects page
If you click on the very last menu item in the top right of the page that looks like a person, you will see a dropdown (Figure 1.13):
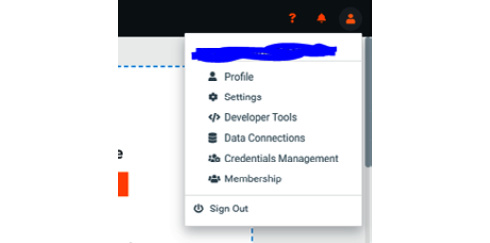
Figure 1.14 – User account management dropdown
From here you can manage your profile and adjust your account settings. If you have admin privileges, you can view and manage other users and groups. You can also sign out of DataRobot if needed.
If you select the Profile menu, you will see details of your account (Figure 1.14):
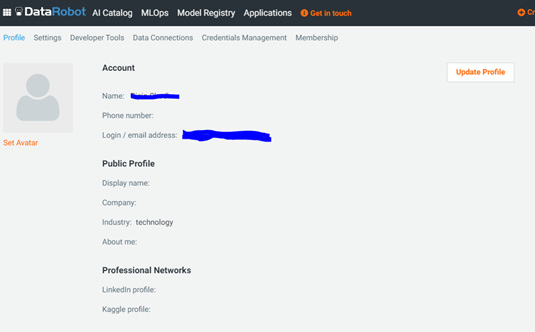
Figure 1.15 – User profile page
Here you can update some of your information. You will also see some new menu choices on the second menu row at the top. This allows you to change settings or access some developer options, and so on. If you select the Settings menu, you will see the following (Figure 1.15):
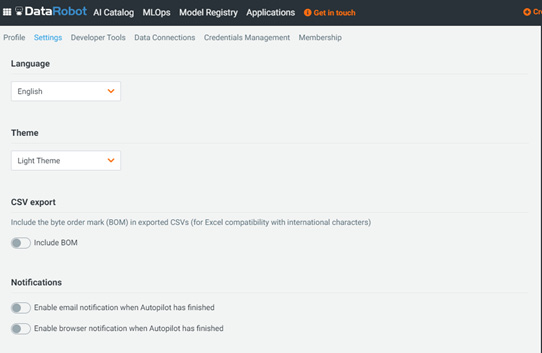
Figure 1.16 – User Settings
On this page, you can change your password, set up two-factor authentication, change the theme, and set up notifications (you will see different options available to you based on how your account was set up by your administrator).
If you select Developer Tools, you will see the following (Figure 1.16):
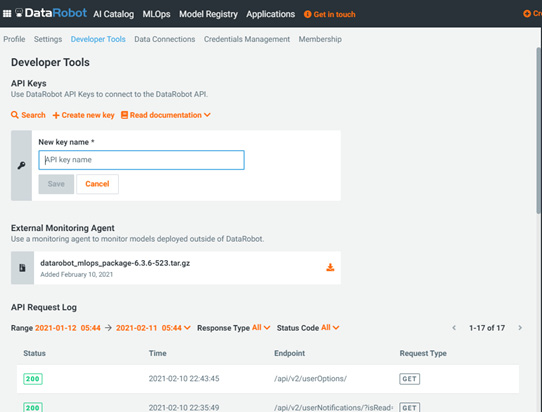
Figure 1.17 – Developer Tools screen
Here you can create an API key associated with your account. This key is useful for authentication if you will be using the DataRobot API. You can also download the API package to set up a portable prediction server to deploy models within your organization's infrastructure.
If you click on the AI Catalog menu at the top, you will see a catalog of shareable datasets available within DataRobot (Figure 1.17):
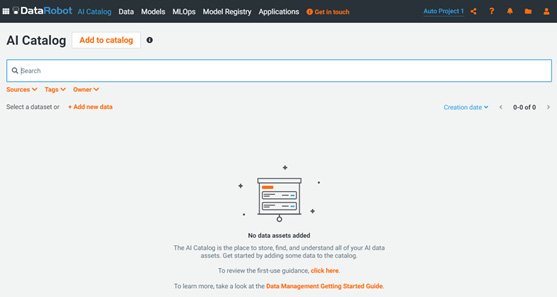
Figure 1.18 – AI Catalog
This page shows you a list of datasets available. If you do not see any datasets, you can upload a test dataset here by clicking on the Add new data button (Figure 1.18). You can also click on a dataset to explore the data available. You can search and sort by sources, user-defined tags, or owner/creator:
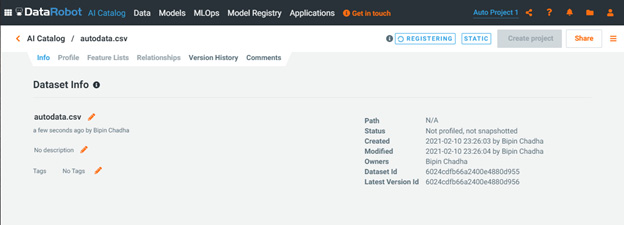
Figure 1.19 – Dataset information page
Normally a dataset is only available within a project. If you want to share datasets across projects or iterations of projects, you can create the dataset within this catalog. This allows you to share these datasets across projects and users. The datasets can be static, or they can be dynamically created using a SQL query as needed. Datasets can also be modified or blended via Spark SQL if you need data from multiple tables or sources for a project.
If you click on the Profile button, you will see profile-level information about the dataset (Figure 1.19). This information is automatically compiled for you. We will describe these capabilities and how to use them in more detail later:
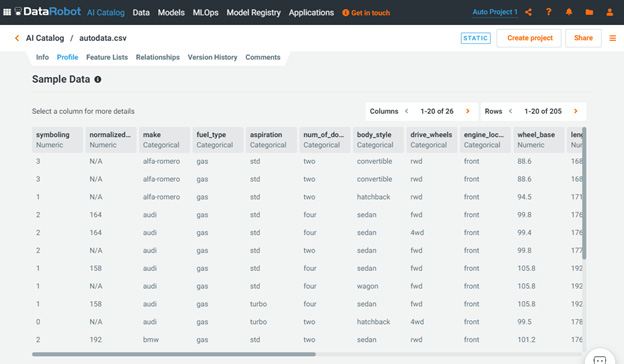
Figure 1.20 – Dataset information page
This page shows details of the dataset that is part of the project that is active at that time. This page is one of the key components of the DataRobot capability. The page shows summary information as well as any data quality issues that DataRobot has detected. Below that, it shows summaries of data features as well as a feature's importance relative to the target feature. We will cover these capabilities in more detail in subsequent chapters.
Let's now click on the Data menu at the top left of the page. This page (Figure 1.20) shows a detailed analysis of the dataset for your currently active project:
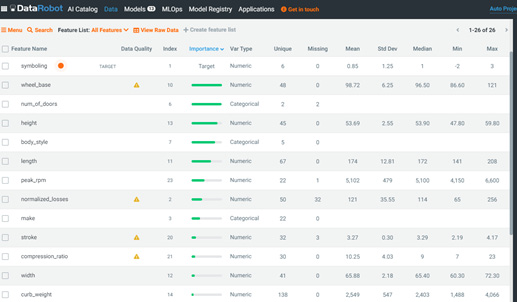
Figure 1.21 – Project data page
This page shows the results of the analysis of your datasets, provides any warnings, relative importance of the features, and the feature lists for use in your project. We will review the functionality of this page in great detail in later chapters.
Let's now click on the Models menu item at the top. This shows the model leaderboard for the active project (Figure 1.21):
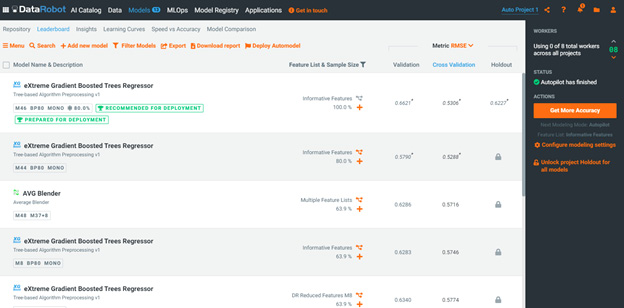
Figure 1.22 – Model leaderboard
This is another critical page where you will spend a lot of your time during the modeling process. Here you can see the top-performing models that DataRobot has built and their performance metrics for validation, cross-validation, and holdout samples. You can drill down into the details of any selected model. It is important to note that DataRobot mostly works with supervised learning problems; currently, it does not have support for unsupervised learning (except for some anomaly detection) or reinforcement learning. Also, support for NLP and image processing problems is limited. Similarly, there are situations where either due to data limitations or extreme scales, you will find that the automation adds a level of overhead that makes it impractical to use DataRobot. If your project requires advanced capabilities in these areas, you will need to work in Python or R directly. More on this in subsequent chapters.
Let's now move to the next menu item, MLOps. When you click on MLOps, you will see the screen shown in Figure 1.22:
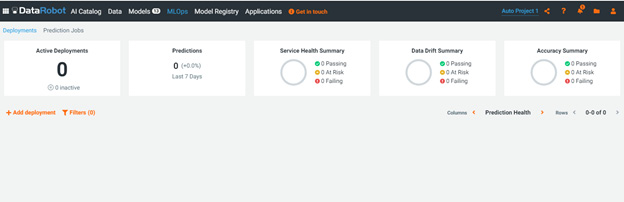
Figure 1.23 – MLOps page
The MLOps page shows you your active deployments and their health. You can set up alerts relating to data drift or model accuracy as needed for your use cases.
The next menu item is Model Registry. Now, Model registry is the mechanism by which you can bring externally developed models into DataRobot. This capability is an add-on that your organization may or may not have purchased. This aspect is an advanced topic that is beyond the scope of this book.
Let's click on the next menu item, Applications. You will now see what's shown in Figure 1.23:
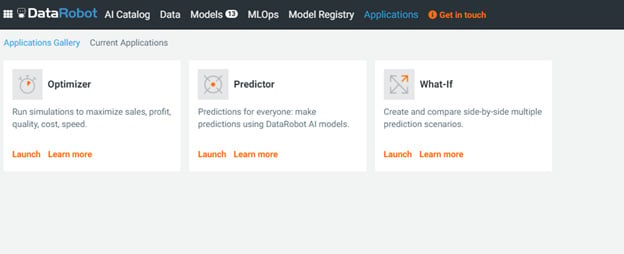
Figure 1.24 – Applications page
Applications is a relatively new functionality in DataRobot that is meant to allow business users to easily access model results without needing to get DataRobot user licenses.
This concludes our quick tour of what DataRobot is and what it looks like. We will revisit many of these components in great detail and see examples of how these are used to take a data science project from start to finish.