
Introducing Optimus
Development of Optimus began with work being conducted for another project. In 2016, Alberto Bonsanto, Hugo Reyes, and I had an ongoing big data project for a national retail business in Venezuela. We learned how to use PySpark and Trifacta to prepare and clean data and to find buying patterns.
But problems soon arose for both technologies: the data had different category/product names over the years, a 10-level categorization tree, and came from different sources, including CSV files, Excel files, and databases, which added an extra process to our workflow and could not be easily wrangled. On the other hand, when we tried Trifacta, we needed to learn its unique syntax. It also lacked some features we needed, such as the ability to remove a single character from every column in the dataset. In addition to that, the tool was closed source.
We thought we could do better. We wanted to write an open source, user-friendly library in Python that would let any non-experienced user apply functions to clean, prepare, and plot big data using PySpark.
From this, Optimus was born.
After that, we integrated other technologies. The first one we wanted to include was cuDF, which supports processing data 20x faster; soon after that, we also integrated Dask, Dask-cuDF, and Ibis. You may be wondering, why so many DataFrame technologies? To answer that, we need to understand a little bit more about how each one works.
Exploring the DataFrame technologies
There are many different well-known DataFrame technologies available today. Optimus can process data using one or many of those available technologies, including pandas, Dask, cuDF, Dask-cuDF, Spark, Vaex, or Ibis.
Let's look at some of the ones that work with Optimus:
- pandas is, without a doubt, one of the more popular DataFrame technologies. If you work with data in Python, you probably use pandas a lot, but it has an important caveat: pandas cannot handle multi-core processing. This means that you cannot use all the power that modern CPUs can give you, which means you need to find a hacky way to use all the cores with pandas. Also, you cannot process data volumes greater than the memory available in RAM, so you need to write code to process your data in chunks.
- Dask came out to help parallelize Python data processing. In Dask, we have the Dask DataFrame, an equivalent to the pandas DataFrame, that can be processed in parallel using multiple cores, as well as with nodes in a cluster. This gives the user the power to scale out data processing to hundreds of machines in a cluster. You can start 100 machines, process your data, and shut them down, quickly, easily, and cheaply. Also, it supports out-of-core processing, which means that it can process data volumes greater than the memory available in RAM.
- At the user level, cuDF and Dask-cuDF work in almost the same way as pandas and Dask, but up to 20x faster for most operations when using GPUs. Although GPUs are expensive, they give you more value for money compared to CPUs because they can process data much faster.
- Vaex is growing in relevance in the DataFrame landscape. It can process data out-of-core, is easier to use than Dask and PySpark, and is optimized to process string and stats in parallel because of its underlying C language implementation.
- Ibis is gaining traction too. The amazing thing about Ibis is that it can use multiple engines (like Optimus but focused on SQL engines) and you can write code in Python that can be translated into SQL to be used in Impala, MySQL, PostgreSQL, and so on.
The following table provides a quick-glance comparison of several of these technologies:
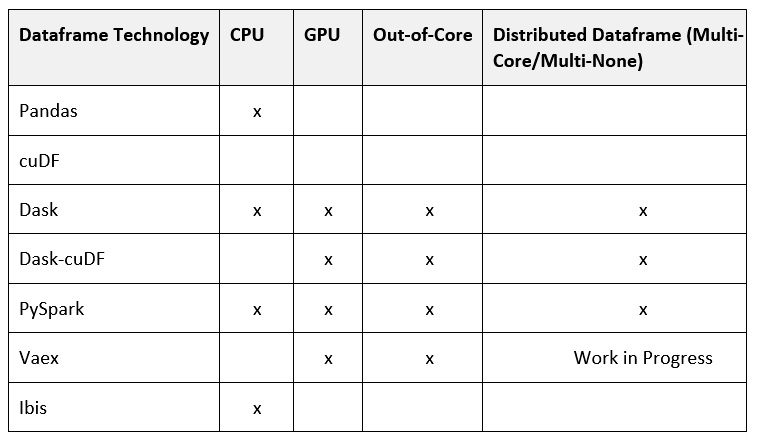
(*) Depends on the engine that's been configured
Figure 1.1 – DataFrame technologies and capabilities available in Optimus
There are some clear guidelines regarding when to use each engine:
- Use pandas if the DataFrame fits comfortably in memory, or cuDF if you have GPUs and the data fits in memory. This is almost always faster than using distributed DataFrame technologies under the same circumstances. This works best for real-time or near-real-time data processing.
- Use Dask if you need to process data greater than memory, and Dask-cuDF if you have data larger than memory and a multi-core and/or multi-node GPU infrastructure.
- Use Vaex if you have a single machine and data larger than memory, or Spark if you need to process data at terabyte scale. This is slow for small datasets/datasets that fit in memory.
Now that you understand this, you can unleash Optimus's magic and start preparing data using the same Optimus API in any of the engines available.
Examining Optimus design principles
A key point about Optimus is that we are not trying to create a new DataFrame technology. As we've already seen, there are actually many amazing options that cover almost any use case. The purpose of Optimus is to simplify how users handle data and give that power to people who may not have any technical expertise. For that reason, Optimus follows three principles:
- One API to rule them all.
- Knowing the technology is optional.
- Data types should be as rich as possible.
What do these mean? Let's look at each in detail.
One API to rule them all
Almost all DataFrame technologies try to mimic the pandas API. However, there are subtle differences regarding what the same function can do, depending on how you apply it; with Optimus, we want to abstract all this.
We'll go into more detail about this later, but here's a quick example: you can calculate a column square root using the .cols accessor, like so:
from optimus import Optimus
op = Optimus("dask")
df = op.create.dataframe({"A":[0,-1,2,3,4,5]})
df = df.cols.sqrt("A")
If you want to switch from Dask to any other engine, you can use any of the following values. Each one will instantiate a different class of the Optimus DataFrame:
"pandas"to use Pandas. This will instantiate a pandas DataFrame."dask"to use Dask. This will instantiate a DaskDataFrame."cudf"to use cuDF. This will instantiate a CUDFDataFrame."dask_cudf"to use Dask-cuDF. This will instantiate a DaskCUDFDataFrame."spark"to use PySpark. This will instantiate a SparkDataFrame."vaex"to use Vaex. This will instantiate a VaexDataFrame."ibis"to use Ibis. This will instantiate an IbisDataFrame.
An amazing thing about this flexibility is that you can process a sample of the data on your laptop using pandas, and then send a job to Dask-cuDF or a Spark cluster to process it using the faster engine.
Knowing the technical details is optional
pandas is complex. Users need to handle technical details such as rows, index, series, and masks, and you need to go low level and use NumPy/Numba to get all the power from your CPU/GPU.
With Numba, users can gain serious speed improvements when processing numerical data. It translates Python functions into optimized machine code at runtime. This simply means that we can write faster functions on CPU or GPU. For example, when we request a histogram using Optimus, the minimum and maximum values of a column are calculated in a single pass.
In Optimus, we try to take the faster approach for every operation, without requiring extensive knowledge of the technical details, to take full advantage of the technology. That is Optimus's job.
Some other DataFrame features that are abstracted in Optimus include indices, series, and masks (the exception is PySpark). In Optimus, you only have columns and rows; the intention is to use familiar concepts from spreadsheets so that you can have a soft landing when you start using Optimus.
In Optimus, you have two main accessors, .cols and .rows, that provide most of the transformation methods that are available. For example, you can use df.cols.lower to transform all the values of a column into lowercase, while you can use df.rows.drop_duplicates to drop duplicated rows in the entire dataset. Examples of these will be addressed later in this book.
Data types should be as rich as possible
All DataFrame technologies have data types to represent integers, decimals, time, and dates. In pandas and Dask, you can use NumPy data types to assign diverse types of integers such as int8, int16, int32, and int64, or different decimals types, such as float32, float64, and so on.
This gives the user a lot of control to optimize how the data is saved and reduces the total size of data in memory and on disk. For example, if you have 1 million rows with values between 1 and 10, you can save the data as uint8 instead of inf64 to reduce the data size.
Besides this internal data representation, Optimus can infer and detect a richer set of data types so that you can understand what data in a column matches a specific data type (URL, email, date, and so on) and then apply specific functions to handle it.
In Optimus, we use the term quality to express three data characteristics:
- Number of values that match the data type being inferred
- Number of values that differ from the data type being inferred
- Number of missing values
Using the df.cols.quality method, Optimus can infer the data type of every loaded column and return how many values in the column match its data types. In the case of date data types, Optimus can infer the date format.
The following list shows all the data types that Optimus can detect:
- Integer.
- Strings.
- Email.
- URL.
- Gender.
- Boolean.
- US ZIP code.
- Credit card.
- Time and date format.
- Object.
- Array.
- Phone number.
- Social security number.
- HTTP code.
Many of these data types have special functions that you can use, as follows:
- URL: Schemas, domains, extensions, and query strings
- Date: Year, month, and day
- Time: Hours, minutes, and seconds
- Email: domains and domain extensions
The best part of this is that you can define your own data types and create special functions for them. We will learn more about this later in this book. We will also learn about the functions we can use to process or remove matches, mismatches, and missing values.
Now that we've had a look at how Optimus works, let's get it running on your machine.