Book Image

Hands-On Financial Modeling with Excel for Microsoft 365 - Second Edition

By : Shmuel Oluwa
Book Image

Hands-On Financial Modeling with Excel for Microsoft 365 - Second Edition

By: Shmuel Oluwa

Overview of this book

Financial modeling is a core skill required by anyone who wants to build a career in finance. Hands-On Financial Modeling with Excel for Microsoft 365 explores financial modeling terminologies with the help of Excel. Starting with the key concepts of Excel, such as formulas and functions, this updated second edition will help you to learn all about referencing frameworks and other advanced components for building financial models. As you proceed, you'll explore the advantages of Power Query, learn how to prepare a 3-statement model, inspect your financial projects, build assumptions, and analyze historical data to develop data-driven models and functional growth drivers. Next, you'll learn how to deal with iterations and provide graphical representations of ratios, before covering best practices for effective model testing. Later, you'll discover how to build a model to extract a statement of comprehensive income and financial position, and understand capital budgeting with the help of end-to-end case studies. By the end of this financial modeling Excel book, you'll have examined data from various use cases and have developed the skills you need to build financial models to extract the information required to make informed business decisions.
Table of Contents (19 chapters)
1
Part 1 – Financial Modeling Overview
4
Part 2 – The Use of Excel Features and Functions for Financial Modeling
8
Part 3 – Building an Integrated 3-Statement Financial Model with Valuation by DCF
15
Part 4 – Case Study

Different ways to use Power Query

Power Query is extremely versatile and user-friendly. The following are just a few of the many different ways to use Power Query:

  • Create a connection/Merge queries:

The simplest way to use Power Query is to get a table into the Power Query window, then immediately create a connection from the Import data dialog box, as seen in Figure 5.4. Repeat this for one or more other tables.

You can then merge two or more queries with the same headers using the Data ribbon to go to Get Data | Combine Queries | Merge (see Figure 5.5):

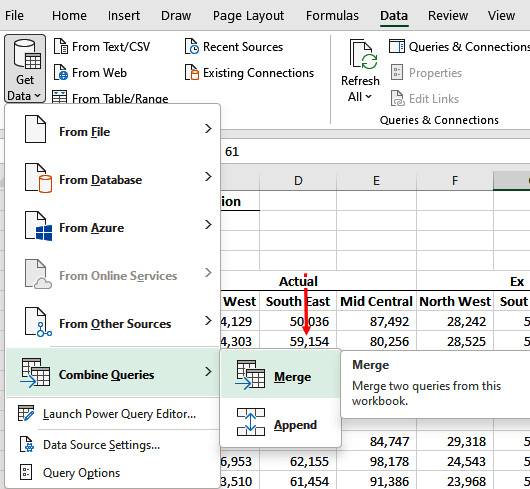
Figure 5.5 – Merge queries from the Data ribbon, Combine Queries, and Merge

  • Append queries: This option allows you to append a table to the bottom of another.

For example, if you have monthly sales reports, you can upload January and February sales separately into Power Query, and then create a connection for each.

You can then append February sales to January sales...