


-
Book Overview & Buying
-
Table Of Contents

Data Forecasting and Segmentation Using Microsoft Excel
By :


Data Forecasting and Segmentation Using Microsoft Excel
By:
Overview of this book
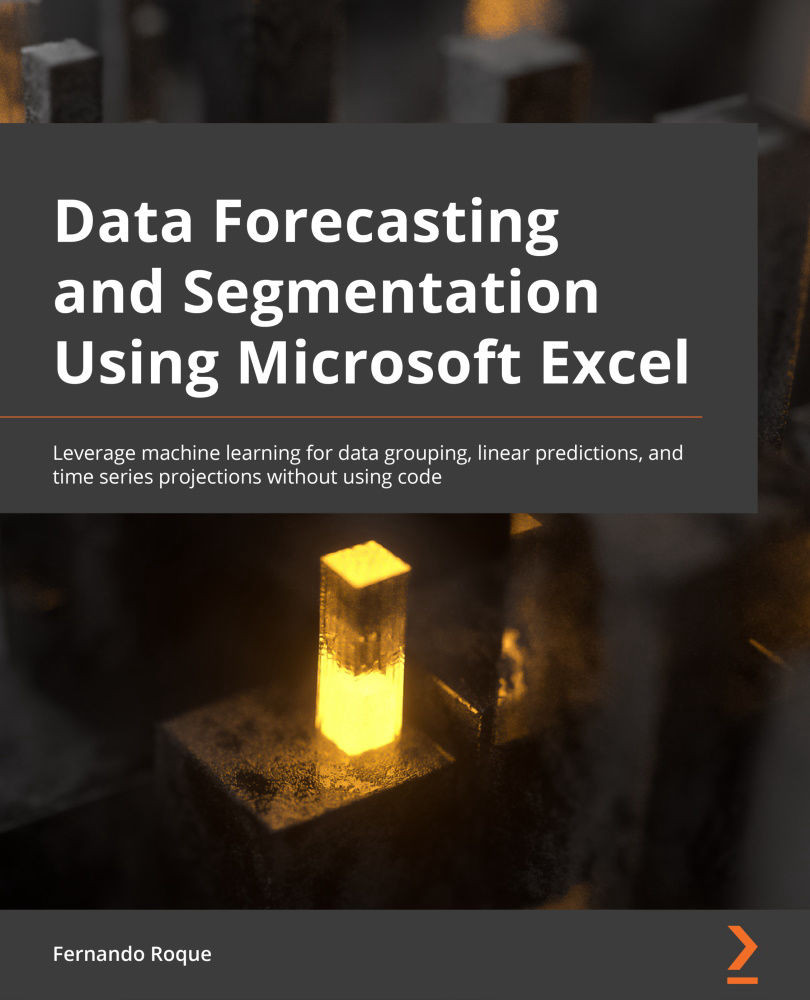
Data Forecasting and Segmentation Using Microsoft Excel guides you through basic statistics to test whether your data can be used to perform regression predictions and time series forecasts. The exercises covered in this book use real-life data from Kaggle, such as demand for seasonal air tickets and credit card fraud detection.
You’ll learn how to apply the grouping K-means algorithm, which helps you find segments of your data that are impossible to see with other analyses, such as business intelligence (BI) and pivot analysis. By analyzing groups returned by K-means, you’ll be able to detect outliers that could indicate possible fraud or a bad function in network packets.
By the end of this Microsoft Excel book, you’ll be able to use the classification algorithm to group data with different variables. You’ll also be able to train linear and time series models to perform predictions and forecasts based on past data.
Table of Contents (19 chapters)
Preface


Part 1 – An Introduction to Machine Learning Functions
 Free Chapter
Chapter 1: Understanding Data Segmentation
Chapter 2: Applying Linear Regression
Chapter 3: What is Time Series?
Part 2 – Grouping Data to Find Segments and Outliers
Chapter 4: Introduction to Data Grouping
Chapter 5: Finding the Optimal Number of Single Variable Groups
Chapter 6: Finding the Optimal Number of Multi-Variable Groups
Chapter 7: Analyzing Outliers for Data Anomalies
Part 3 – Simple and Multiple Linear Regression Analysis
Chapter 8: Finding the Relationship between Variables
Chapter 9: Building, Training, and Validating a Linear Model

Chapter 10: Building, Training, and Validating a Multiple Regression Model
Part 4 – Predicting Values with Time Series
Chapter 11: Testing Data for Time Series Compliance
Chapter 12: Working with Time Series Using the Centered Moving Average and a Trending Component
Chapter 13: Training, Validating, and Running the Model
Other Books You May Enjoy


