

The bar across the top of the window contains information about where you are as well as quick links to preferences, other apps, and administration.
The current app is specified in the upper-left corner. The following screenshot shows the upper-left Splunk bar when using the Search & Reporting app:

Clicking on the text takes you to the default page for that app. In most apps, the text next to the logo is simply changed, but the whole block can be customized with logos and alternate text by modifying the app's CSS. We will cover this in Chapter 7, Working with Apps:

The upper-right corner of the window, as seen in the previous screenshot, contains action links that are almost always available:
-
The name of the user who is currently logged in appears first. In this case, the user is Administrator. Previously, clicking on the username allowed you to select Edit Account (which would take you to the Your account page) or Logout (of Splunk). In version 7.0, it's a bit different. The first option is now listed as Account Settings, which opens a settings page similar to prior versions (below is the 7.0 page). Logout is the other option, and, like prior versions, it ends the session and forces the user to log in again.
The following screenshot shows what the your account page looks like:
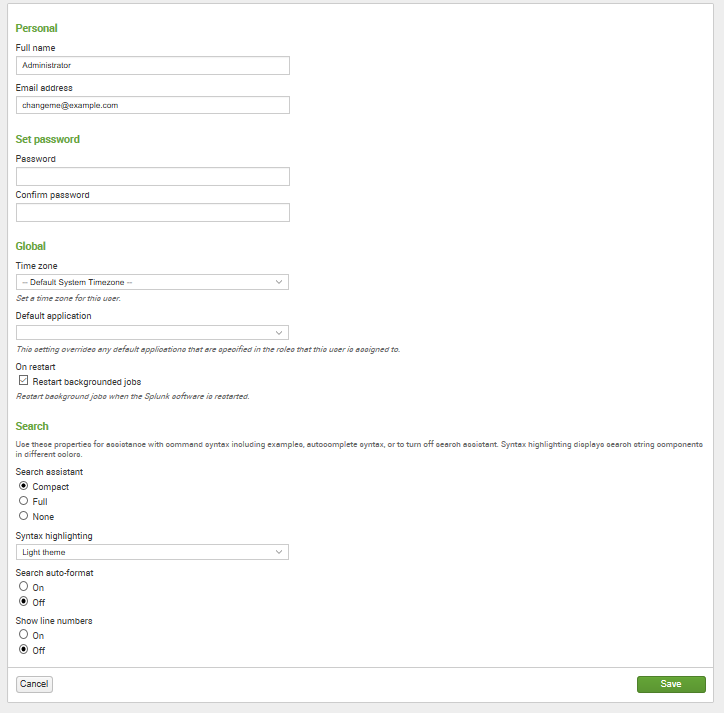
This form presents the global preferences that a user is allowed to change. Other settings that affect users are configured through permissions on objects and settings on roles. (Note that preferences can also be configured using the command-line interface or by modifying specific Splunk configuration files.) Preferences include the following:
- Full name and Email address are stored for the administrator's convenience.
- Set password allows you to change your password. This is relevant only if Splunk is configured to use internal authentication. For instance, if the system is configured to use Windows Active Directory via LDAP (a very common configuration), users must change their password in Windows.
- Global/Time zone can be changed for the logged-in user.
- Default application controls where you first land after login. Most users will want to change this to search.
- Restart backgrounded jobs controls whether unfinished queries should run again if Splunk is restarted.
-
Search/Search assistant/Syntax highlighting/auto-format and Show line numbers: these properties are used for assistance with command syntax, including examples, autocomplete syntax, or to turn off search assistance. Syntax highlighting displays search string components in different colors.
-
Messages allows you to view any system-level error messages you may have pending. When there is a new message for you to review, a notification displays as a count next to the Messages menu. You can click on the X to remove a message.
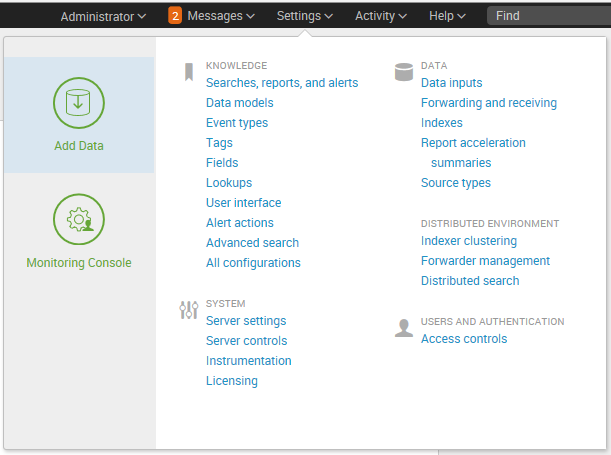
- The Settings link presents the user with the configuration pages for all Splunk Knowledge objects, Distributed environment, System and Licensing, Data, and Users and Authentication settings. For any option that you are unable to see, you do not have the permissions to view or edit it:
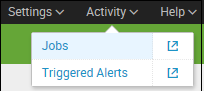
- The Activity menu lists shortcuts to Splunk Jobs, Triggered Alerts, and (in previous versions System Activity) views.
- You can click on Jobs (to open the search jobs manager window, where you can view and manage currently running searches) or Triggered Alerts (to view scheduled alerts that are triggered).
- Help lists links to video tutorials, Splunk Answers, the Splunk Contact Support portal, and online Documentation:

- Find can be used to search for objects within your Splunk Enterprise instance. These saved objects include Reports, Dashboards, Alerts, and so on. Errors can be searched with the Search & Reporting app by clicking on Open error in search.