

The Settings section, in a nutshell, is an interface for managing configuration files. The number of files and options in these configuration files is truly daunting, so the web interface concentrates on the most commonly used options across the different configuration types.
Splunk is controlled exclusively by plain text configuration files. Feel free to take a look at the configuration files that are being modified as you make changes in the admin interface. You will find them by hitting the following locations:
$SPLUNK_HOME/etc/system/local/
$SPLUNK_HOME/etc/apps/
$SPLUNK_HOME/etc/users/<user>/<app>/local
You may notice configuration files with the same name at different locations. We will cover in detail the different configuration files, their purposes, and how these configurations merge together in Chapter 10, Configuring Splunk. Don't start modifying the configurations directly until you understand what they do and how they merge.
Clicking on Settings on the top bar takes you to the Settings page:
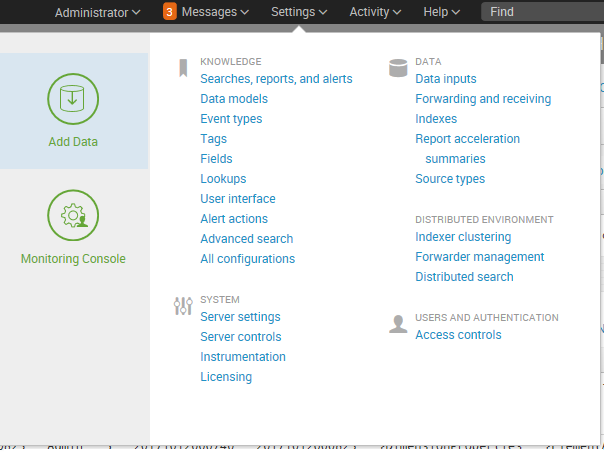
The reader will note that the layout of the setting page has changed a bit in version 7.0, but it is generally the same as prior versions. We'll point out the differences here. First, there have been some name changes (Distributed Management Console is now Monitoring Console) and a few extra links added (under SYSTEM we see Instrumentation, and DATA has added Source Types).
The options are organized into logical groupings, as follows:
-
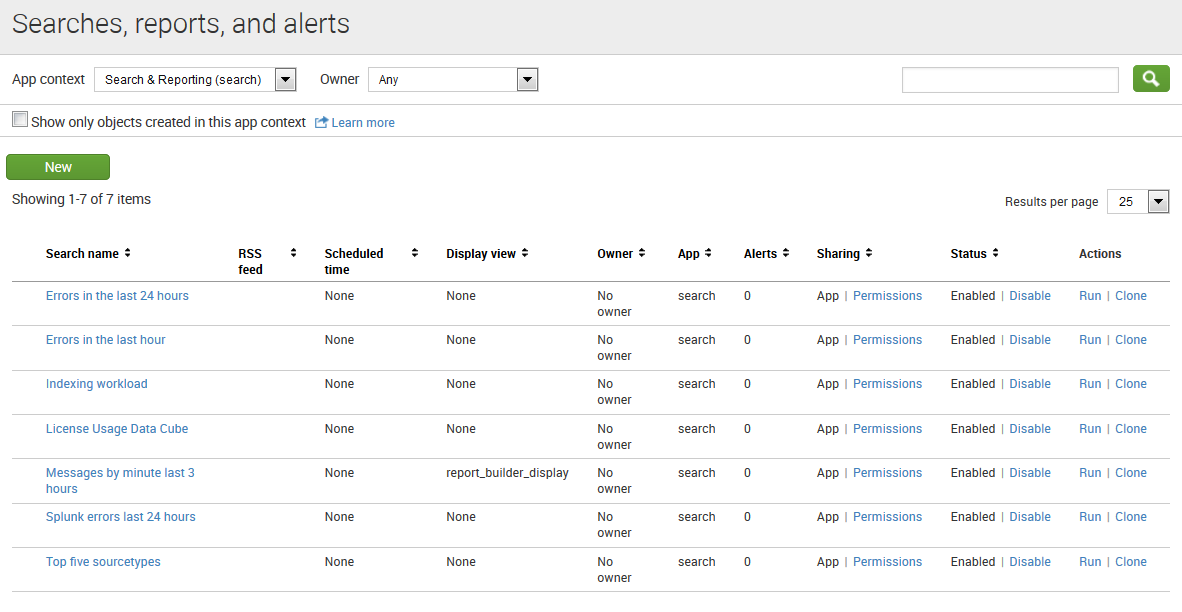
KNOWLEDGE: Each of the links under KNOWLEDGE allows you to control one of the many object types that are used at search time. The following screenshot shows an example of one object type, workflow actions: Searches, reports, and alerts:
- System: The options under this section control system-wide settings:
- System settings covers network settings, the default location to store indexes, outbound email server settings, and how much data Splunk logs about itself
- Server controls contains a single page that lets you restart Splunk from the web interface
- Licensing lets you add license files or configure Splunk as a slave to a Splunk license server
- Instrumentation (new to version 7.0) lets you configure automated reporting settings, view collected data, export data to a file, or send data to Splunk
- Data: This section is where you manage the data flow:
- Data Inputs: Splunk can receive data by reading files (either in batch mode or in real time), listening to network ports, or running scripts.
- Forwarding and receiving: Splunk instances don't typically stand alone. Most installations consist of at least one Splunk indexer and many Splunk forwarders. Using this interface, you can configure each side of this relationship and more complicated setups .
- Indexes: An index is essentially a data store. Under the covers, it is simply a set of directories, created and managed by Splunk. For small installations, a single index is usually acceptable. For larger installations, using multiple indexes allows flexibility in security, retention, and performance tuning, as well as better use of hardware. We will discuss this further in Chapter 10, Configuring Splunk.
- Report acceleration summaries: Accesses automatically-created summaries to speed up completion times for certain kinds of reports.
-
Source Types: Allows access to the source types page. Source types are used to assign configurations like timestamp recognition, event breaking, and field extractions to data indexed by Splunk.
- Distributed environment: The three options here relate to distributed deployments :
- Indexer clustering: Access to enabling and configuring Splunk Indexer clustering, which we will discuss later in this book.
- Forwarder management: Access to the forwarder management UI distributes deployment apps to Splunk clients.
- Distributed search: Any Splunk instance running searches can utilize itself and other Splunk instances to retrieve results. This interface allows you to configure access to other Splunk instances.
- Users and authentication: This section provides authentication controls and an account link:
- Access controls: This section is for controlling how Splunk authenticates users and what users are allowed to see and do. We will discuss this further in Chapter 10, Configuring Splunk.
In addition to the links, the Settings page also presents a panel on the left-hand side of the page. This panel includes two icons, Add Data and (previously) Distributed Management Console, now Monitoring Console:
- Add Data links to the Add Data page. This page presents you with three options for getting data into your Splunk Enterprise instance: Upload, Monitor, and Forward.
- Monitoring Console is where you can view detailed performance information about your Splunk Enterprise deployment.