Book Image

Essential Statistics for Non-STEM Data Analysts

By : Rongpeng Li
Book Image

Essential Statistics for Non-STEM Data Analysts

By: Rongpeng Li

Overview of this book

Statistics remain the backbone of modern analysis tasks, helping you to interpret the results produced by data science pipelines. This book is a detailed guide covering the math and various statistical methods required for undertaking data science tasks. The book starts by showing you how to preprocess data and inspect distributions and correlations from a statistical perspective. You’ll then get to grips with the fundamentals of statistical analysis and apply its concepts to real-world datasets. As you advance, you’ll find out how statistical concepts emerge from different stages of data science pipelines, understand the summary of datasets in the language of statistics, and use it to build a solid foundation for robust data products such as explanatory models and predictive models. Once you’ve uncovered the working mechanism of data science algorithms, you’ll cover essential concepts for efficient data collection, cleaning, mining, visualization, and analysis. Finally, you’ll implement statistical methods in key machine learning tasks such as classification, regression, tree-based methods, and ensemble learning. By the end of this Essential Statistics for Non-STEM Data Analysts book, you’ll have learned how to build and present a self-contained, statistics-backed data product to meet your business goals.
Table of Contents (19 chapters)
1
Section 1: Getting Started with Statistics for Data Science
5
Section 2: Essentials of Statistical Analysis
10
Section 3: Statistics for Machine Learning
15
Section 4: Appendix

Understanding mean, median, and mode

Mean, median, and mode describe the central tendency in some way. Mean and median are only applicable to numerical variables whereas mode is applicable to both categorical and numerical variables. In this section, we will be focusing on mean, median, and mode for numerical variables as their numerical interactions usually convey interesting observations.

Mean

Mean, or arithmetical mean, measures the weighted center of a variable. Let's use n to denote the total number of entries and as the index. The mean reads as follows:

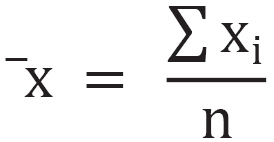
Mean is influenced by the value of every entry in the population.

Let me give an example. In the following code, I will generate 1,000 random numbers from 0 to 1 uniformly, plot them, and calculate their mean:

import random
random.seed(2019)
plt.figure(figsize=(8,6))
rvs = [random.random() for _ in range(1000)]
plt.hist(rvs, bins=50)
plt.title("Histogram of Uniformly Distributed...