Once data has been revised to ensure that it can be used for the desired purpose, it is time to load the dataset and use data visualization to further understand it. Data visualization is not a requirement for developing a machine learning project, especially when dealing with datasets with hundreds or thousands of features. However, it has become an integral part of machine learning, mainly for visualizing the following:
- Specific features that are causing trouble (for example, those that contain many missing or outlier values) and how to deal with them.
- The results from the model, such as the clusters that have been created or the number of predicted instances for each labeled category.
- The performance of the model, in order to see the behavior along different iterations.
Data visualization's popularity in the aforementioned tasks can be explained by the fact that the human brain processes information easily when it is presented as charts or graphs, which allows us to have a general understanding of the data. It also helps us to identify areas that require attention, such as outliers.
Loading the Dataset Using pandas
One way of storing a dataset to easily manage it is by using pandas DataFrames. These work as two-dimensional size-mutable matrices with labeled axes. They facilitate the use of different pandas functions to modify the dataset for pre-processing purposes.
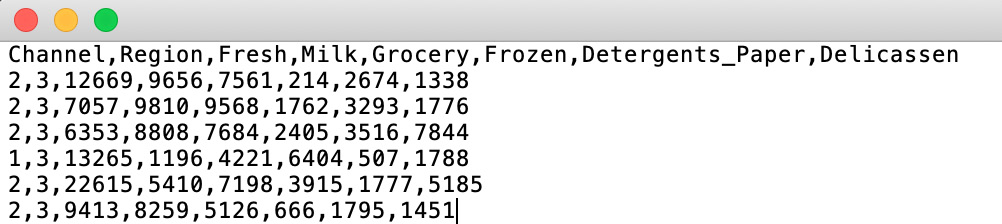
Most datasets found in online repositories or gathered by companies for data analysis are in Comma-Separated Values (CSV) files. CSV files are text files that display the data in the form of a table. Columns are separated by commas (,) and rows are on separate lines:
Figure 2.2: A screenshot of a CSV file
Loading a dataset stored in a CSV file and placing it into a DataFrame is extremely easy with the pandas read_csv() function. It receives the path to your file as an argument.
Note
When datasets are stored in different forms of files, such as in Excel or SQL databases, use the pandas read_xlsx() or read_sql() function, respectively.
The following code shows how to load a dataset using pandas:
import pandas as pd
file_path = "datasets/test.csv"
data = pd.read_csv(file_path)
print(type(data))
First of all, pandas is imported. Next, the path to the file is defined in order to input it into the read_csv() function. Finally, the type of the data variable is printed to verify that a Pandas DataFrame has been created.
The output is as follows:
<class 'pandas.core.frame.DataFrame'>
As shown in the preceding snippet, the variable named data is of a pandas DataFrame.
Visualization Tools
There are different open source visualization libraries available, from which seaborn and matplotlib stand out. In the previous chapter, seaborn was used to load and display data; however, from this section onward, matplotlib will be used as our visualization library of choice. This is mainly because seaborn is built on top of matplotlib with the sole purpose of introducing a couple of plot types and to improve the format of the displays. Therefore, once you've learned about matplotlib, you will also be able to import seaborn to improve the visual quality of your plots.
Note
For more information about the seaborn library, visit the following link: https://seaborn.pydata.org/.
In general terms, matplotlib is an easy-to-use Python library that prints 2D quality figures. For simple plotting, the pyplot model of the library will suffice.
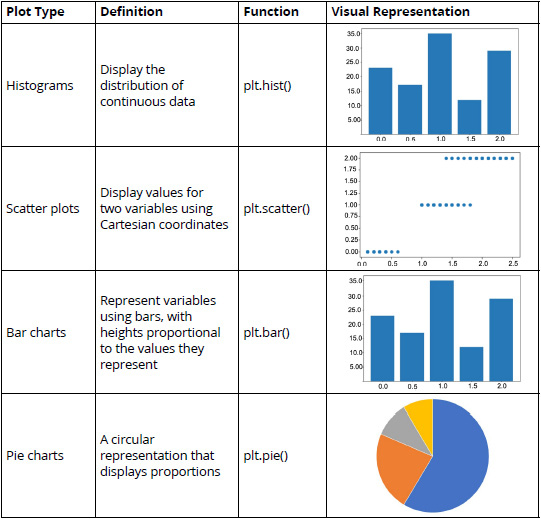
Some of the most commonly used plot types are explained in the following table:
Figure 2.3: A table listing the commonly used plot types (*)
The functions in the third column can be used after importing matplotlib and its pyplot model.
Note
Access matplotlib's documentation regarding the type of plot that you wish to use at https://matplotlib.org/ so that you can play around with the different arguments and functions that you can use to edit the result of your plot.
Exercise 2.01: Plotting a Histogram of One Feature from the Circles Dataset
In this exercise, we will be plotting a histogram of one feature from the circles dataset. Perform the following steps to complete this exercise:
Note
Use the same Jupyter Notebook for all the exercises within this chapter. The circles.csv file is available at https://packt.live/2xRg3ea.
For all the exercises and activities within this chapter, you will need to have Python 3.7, matplotlib, NumPy, Jupyter, and pandas installed on your system.
- Open a Jupyter Notebook to implement this exercise.
- First, import all of the libraries that you are going to be using by typing the following code:
import pandas as pd
import numpy as np
import matplotlib.pyplot as plt
The pandas library is used to save the dataset into a DataFrame, matplotlib is used for visualization, and NumPy is used in later exercises of this chapter, but since the same Notebook will be used, it has been imported here.
- Load the circles dataset by using Pandas'
read_csv function. Type in the following code: data = pd.read_csv("circles.csv")
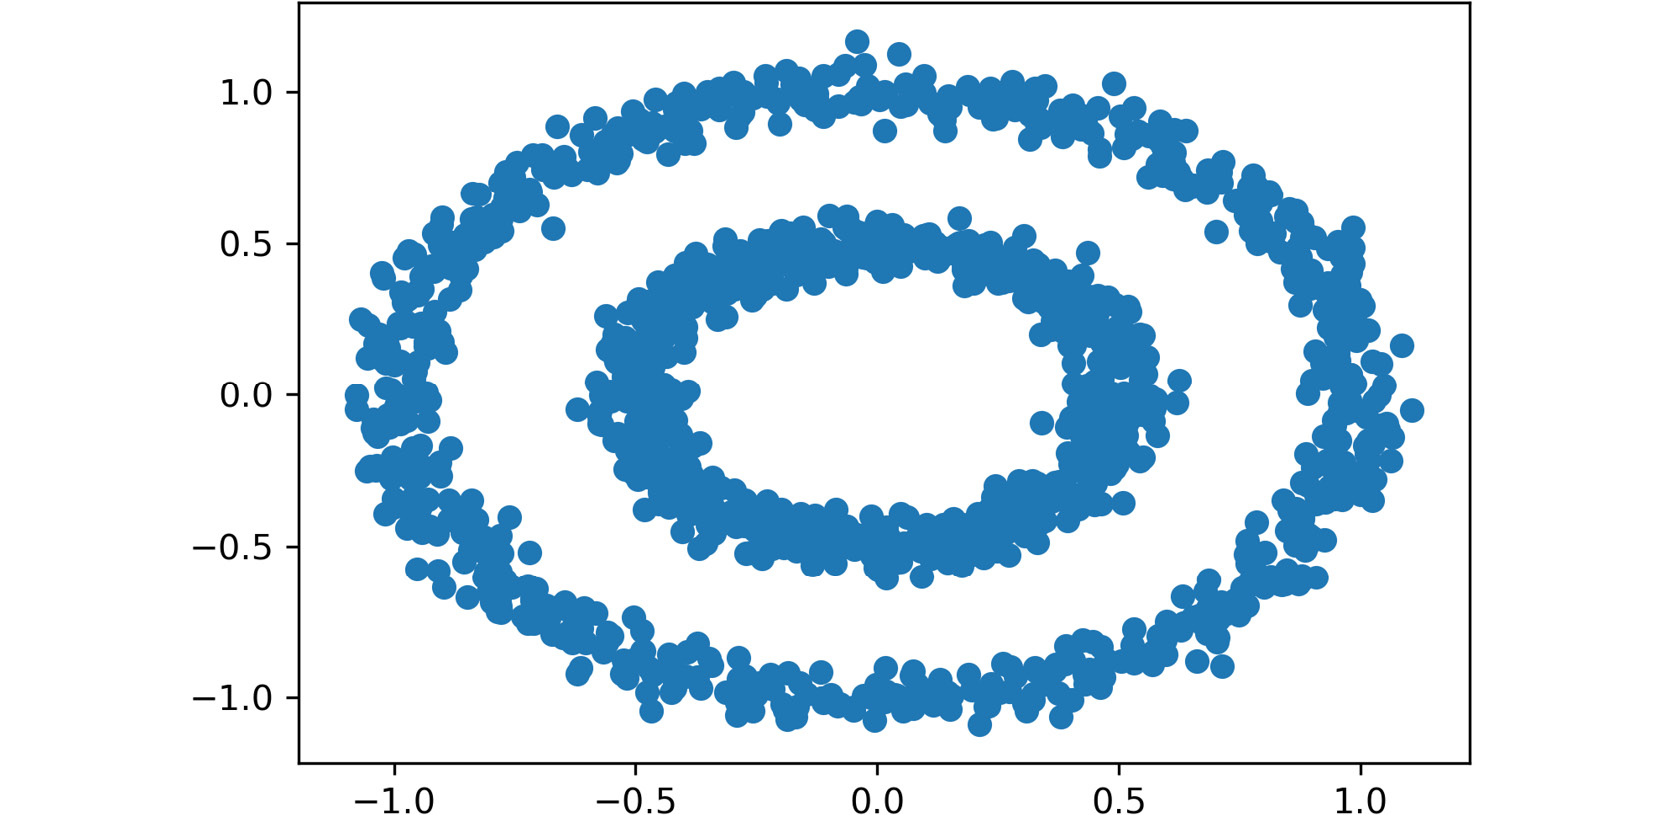
plt.scatter(data.iloc[:,0], data.iloc[:,1])
plt.show()A variable named data is created to store the circles dataset. Finally, a scatter plot is drawn to display the data points in a data space, where the first element is the first column of the dataset and the second element is the second column of the dataset, creating a two-dimensional plot:
Note
The Matplotlib's show() function is used to trigger the display of the plot, considering that the preceding lines only create it. When programming in Jupyter Notebooks, using the show() function is not required, but it is good practice to use it since, in other programming environments, it is required to use the function to be able to display the plots. This will also allow flexibility in the code. Also, in Jupyter Notebooks, this function results in a much cleaner output.
Figure 2.4: A scatter plot of the circles dataset
The final output is a dataset with two features and 1,500 instances. Here, the dot represents a data point (an observation), where the location is marked by the values of each of the features of the dataset.
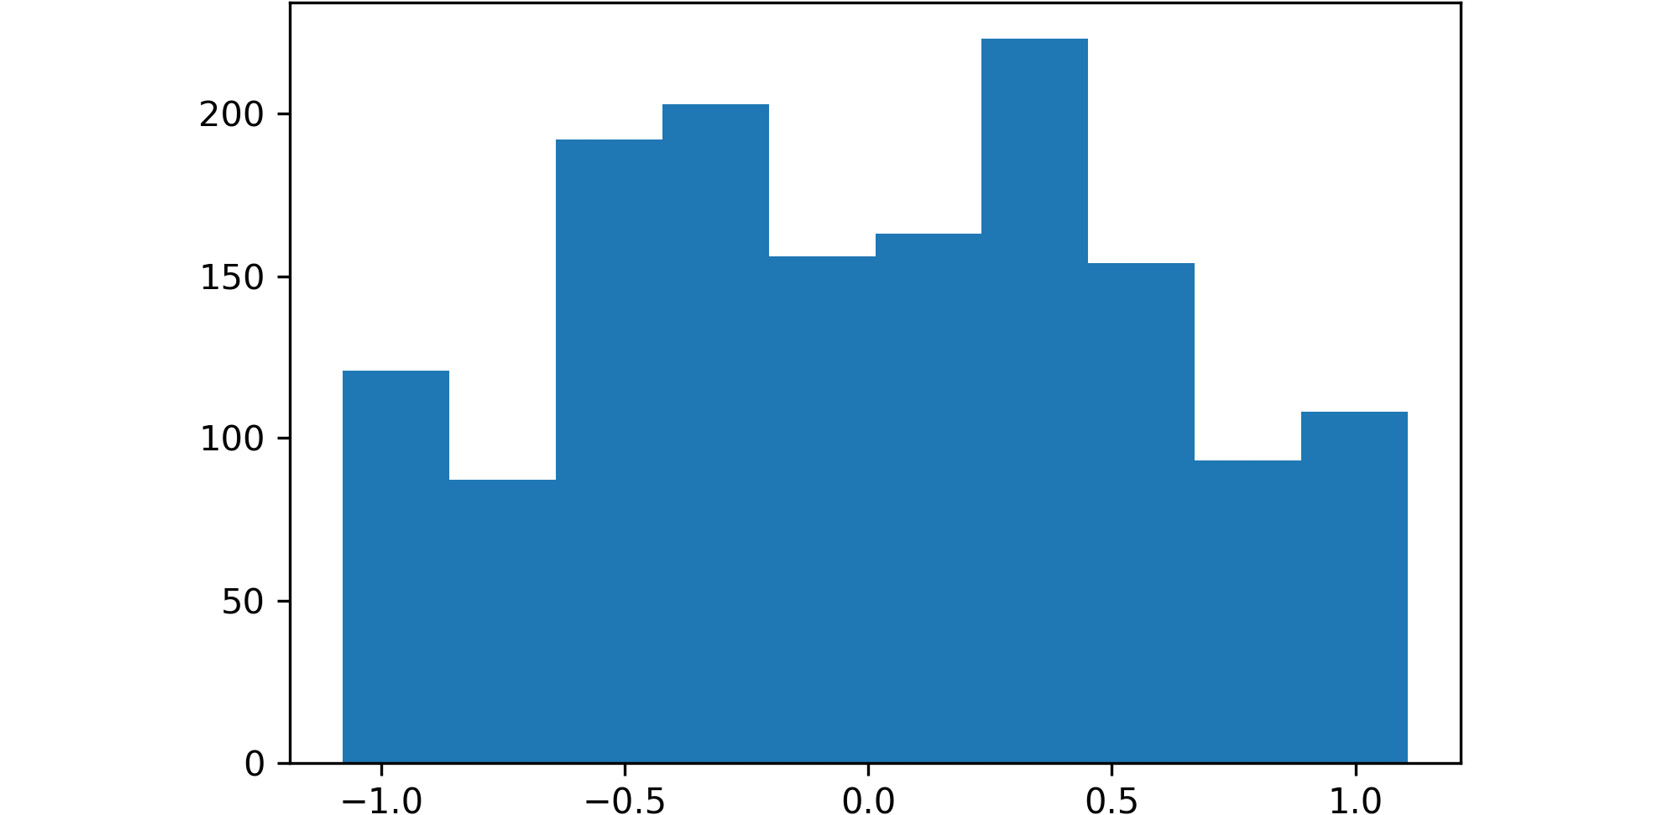
- Create a histogram out of one of the two features. Use slicing to select the feature that you wish to plot:
plt.hist(data.iloc[:,0])
plt.show()
The plot will look similar to the one shown in the following graph:
Figure 2.5: A screenshot showing the histogram obtained using data from the first feature
Note
To access the source code for this specific section, please refer to https://packt.live/2xRg3ea.
You can also run this example online at https://packt.live/2N0L0Rj. You must execute the entire Notebook in order to get the desired result.
You have successfully created a scatter plot and a histogram using matplotlib. Similarly, different plot types can be created using matplotlib.
In conclusion, visualization tools help you better understand the data that's available in a dataset, the results from a model, and the performance of the model. This happens because the human brain is receptive to visual forms, instead of large files of data.
Matplotlib has become one of the most commonly used libraries to perform data visualization. Among the different plot types that the library supports, there are histograms, bar charts, and scatter plots.
Activity 2.01: Using Data Visualization to Aid the Pre-processing Process
The marketing team of your company wants to know about the different profiles of the clients so that it can focus its marketing effort on the individual needs of each profile. To do so, it has provided your team with a list of 440 pieces of previous sales data. Your first task is to pre-process the data. You will present your findings using data visualization techniques in order to help your colleagues understand the decisions you took in that process. You should load a CSV dataset using pandas and use data visualization tools to help with the pre-processing process. The following steps will guide you on how to do this:
- Import all the required elements to load the dataset and pre-process it.
- Load the previously downloaded dataset by using Pandas'
read_csv() function, given that the dataset is stored in a CSV file. Store the dataset in a pandas DataFrame named data.
- Check for missing values in your DataFrame. If present, handle the missing values and support your decision with data visualization.
Note
Use data.isnull().sum() to check for missing values in the entire dataset at once, as we learned in the previous chapter.
- Check for outliers in your DataFrame. If present, handle the outliers and support your decision with data visualization.
Note
Mark all the values that are three standard deviations away from the mean as outliers.
- Rescale the data using the formula for normalization or standardization.
Note
Standardization tends to work better for clustering purposes. The solution for this activity can be found via this link.
Expected output: Upon checking the DataFrame, you should find no missing values in the dataset and six features with outliers.
k-means Algorithm
The k-means algorithm is used to model data without a labeled class. It involves dividing the data into K number of subgroups. The classification of data points into each group is done based on similarity, as explained previously (refer to the Clustering Types section), which, for this algorithm, is measured by the distance from the center (centroid) of the cluster. The final output of the algorithm is each data point linked to the cluster it belongs to and the centroid of that cluster, which can be used to label new data in the same clusters.
The centroid of each cluster represents a collection of features that can be used to define the nature of the data points that belong there.
Understanding the Algorithm
The k-means algorithm works through an iterative process that involves the following steps:
- Based on the number of clusters defined by the user, the centroids are generated either by setting initial estimates or by randomly choosing them from the data points. This step is known as initialization.
- All the data points are assigned to the nearest cluster in the data space by measuring their respective distances from the centroid, known as the assignment step. The objective is to minimize the squared Euclidean distance, which can be defined by the following formula:
min dist(c,x)2
Here, c represents a centroid, x refers to a data point, and dist() is the Euclidean distance.
- Centroids are calculated again by computing the mean of all the data points belonging to a cluster. This step is known as the update step.
Steps 2 and 3 are repeated in an iterative process until a criterion is met. This criterion can be as follows:
- The number of iterations defined.
- The data points do not change from cluster to cluster.
- The Euclidean distance is minimized.
The algorithm is set to always arrive at a result, even though this result may converge to a local or a global optimum.
The k-means algorithm receives several parameters as inputs to run the model. The most important ones to consider are the initialization method (init) and the number of clusters (K).
Note
To check out the other parameters of the k-means algorithm in the scikit-learn library, visit the following link: http://scikit-learn.org/stable/modules/generated/sklearn.cluster.KMeans.html.
Initialization Methods
An important input of the algorithm is the initialization method to be used to generate the initial centroids. The initialization methods allowed by the scikit-learn library are explained as follows:
k-means++: This is the default option. Centroids are chosen randomly from the set of data points, considering that centroids must be far away from one another. To achieve this, the method assigns a higher probability of being a centroid to those data points that are farther away from other centroids.random: This method chooses K observations randomly from the data points as the initial centroids.
Choosing the Number of Clusters
As we discussed previously, the number of clusters that the data is to be divided into is set by the user; hence, it is important to choose the number of clusters appropriately.
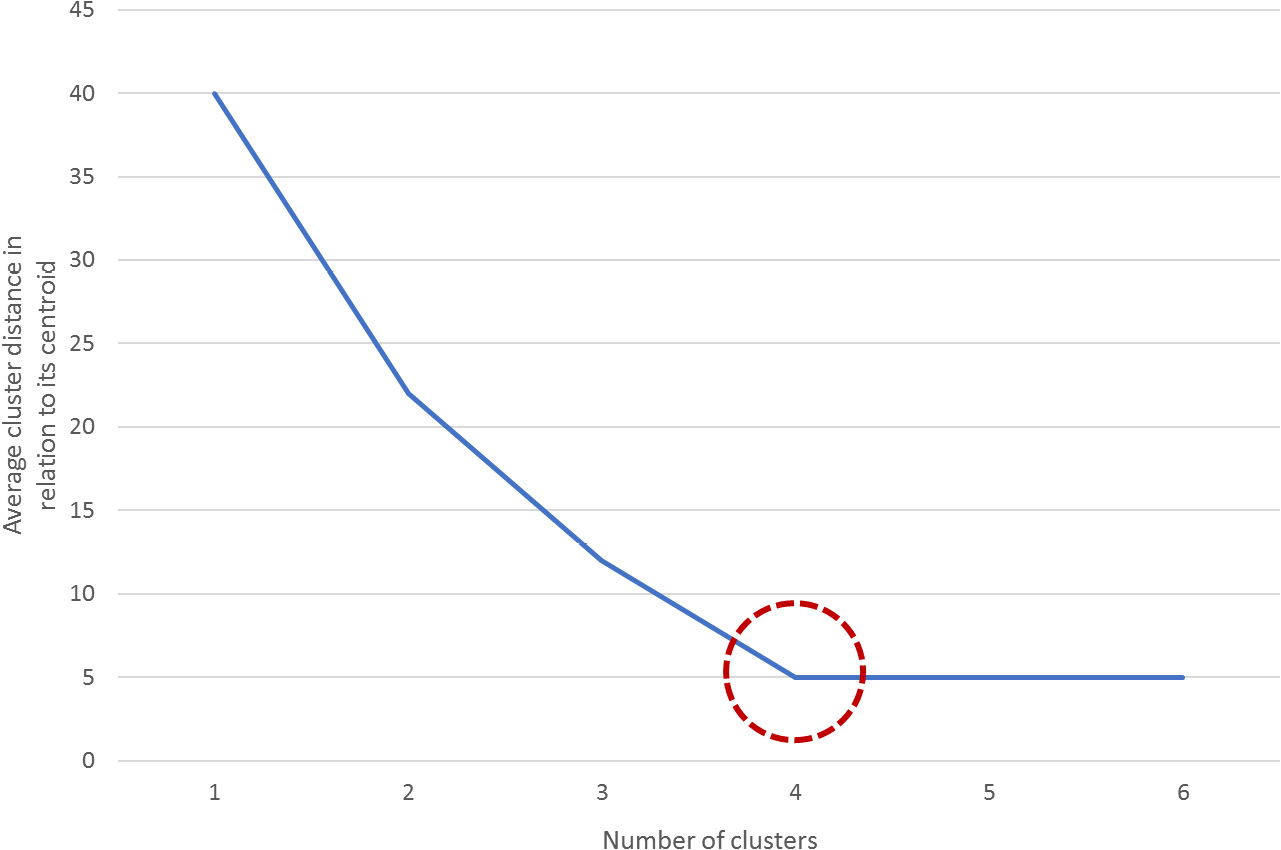
One of the metrics that's used to measure the performance of the k-means algorithm is the mean distance of the data points from the centroid of the cluster that they belong to. However, this measure can be counterproductive as the higher the number of clusters, the smaller the distance between the data points and its centroid, which may result in the number of clusters (K) matching the number of data points, thereby harming the purpose of clustering algorithms.
To avoid this, you can plot the average distance between the data points and the cluster centroid against the number of clusters. The appropriate number of clusters corresponds to the breaking point of the plot, where the rate of decrease drastically changes. In the following diagram, the dotted circle represents the ideal number of clusters:
Figure 2.6: A graph demonstrating how to estimate the breaking point
Exercise 2.02: Importing and Training the k-means Algorithm over a Dataset
The following exercise will be performed using the same dataset from the previous exercise. Considering this, use the same Jupyter Notebook that you used to develop the previous exercise. Perform the following steps to complete this exercise:
- Open the Jupyter Notebook that you used for the previous exercise. Here, you should have imported all the required libraries and stored the dataset in a variable named
data.
- Import the k-means algorithm from scikit-learn as follows:
from sklearn.cluster import KMeans
- To choose the value for K (that is, the ideal number of clusters), calculate the average distance of data points from their cluster centroid in relation to the number of clusters. Use 20 as the maximum number of clusters for this exercise. The following is a snippet of the code for this:
ideal_k = []
for i in range(1,21):
    est_kmeans = KMeans(n_clusters=i, random_state=0)
    est_kmeans.fit(data)
    ideal_k.append([i,est_kmeans.inertia_])
Note
The random_state argument is used to ensure reproducibility of results by making sure that the random initialization of the algorithm remains constant.
First, create the variables that will store the values as an array and name it ideal_k. Next, perform a for loop that starts at one cluster and goes as high as desired (considering that the maximum number of clusters must not exceed the total number of instances).
For the previous example, there was a limitation of a maximum of 20 clusters to be created. As a consequence of this limitation, the for loop goes from 1 to 20 clusters.
Note
Remember that range() is an upper bound exclusive function, meaning that the range will go as far as one value below the upper bound. When the upper bound is 21, the range will go as far as 20.
Inside the for loop, instantiate the algorithm with the number of clusters to be created, and then fit the data to the model. Next, append the pairs of data (number of clusters, average distance to the centroid) to the list named ideal_k.
The average distance to the centroid does not need to be calculated as the model outputs it under the inertia_ attribute, which can be called out as [model_name].inertia_.
- Convert the
ideal_k list into a NumPy array so that it can be plotted. Use the following code snippet:ideal_k = np.array(ideal_k)
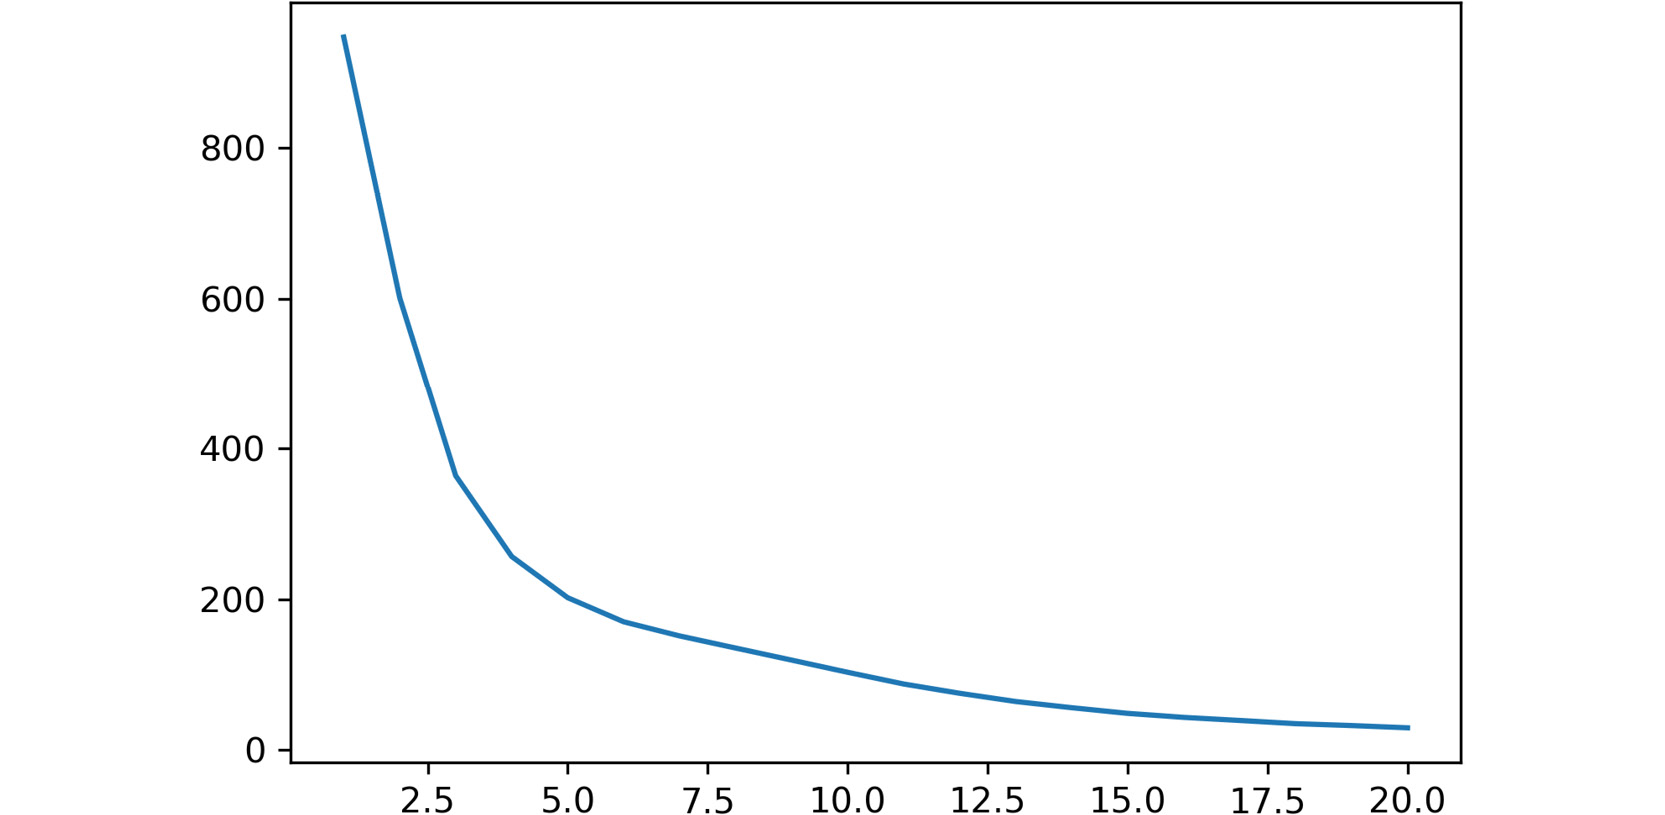
- Plot the relations that you calculated in the preceding steps to find the ideal K to input to the final model:
plt.plot(ideal_k[:,0],ideal_k[:,1])
plt.show()
The output is as follows:
Figure 2.7: A screenshot showing the output of the plot function used
In the preceding plot, the x-axis represents the number of clusters, while the y-axis refers to the calculated average distance of each point in a cluster from their centroid.
The breaking point of the plot is around 5.
- Train the model with
K=5. Use the following code:est_kmeans = KMeans(n_clusters=5, random_state=0)
est_kmeans.fit(data)
pred_kmeans = est_kmeans.predict(data)
The first line instantiates the model with 5 as the number of clusters. Then, the data is fit to the model. Finally, the model is used to assign a cluster to each data point.
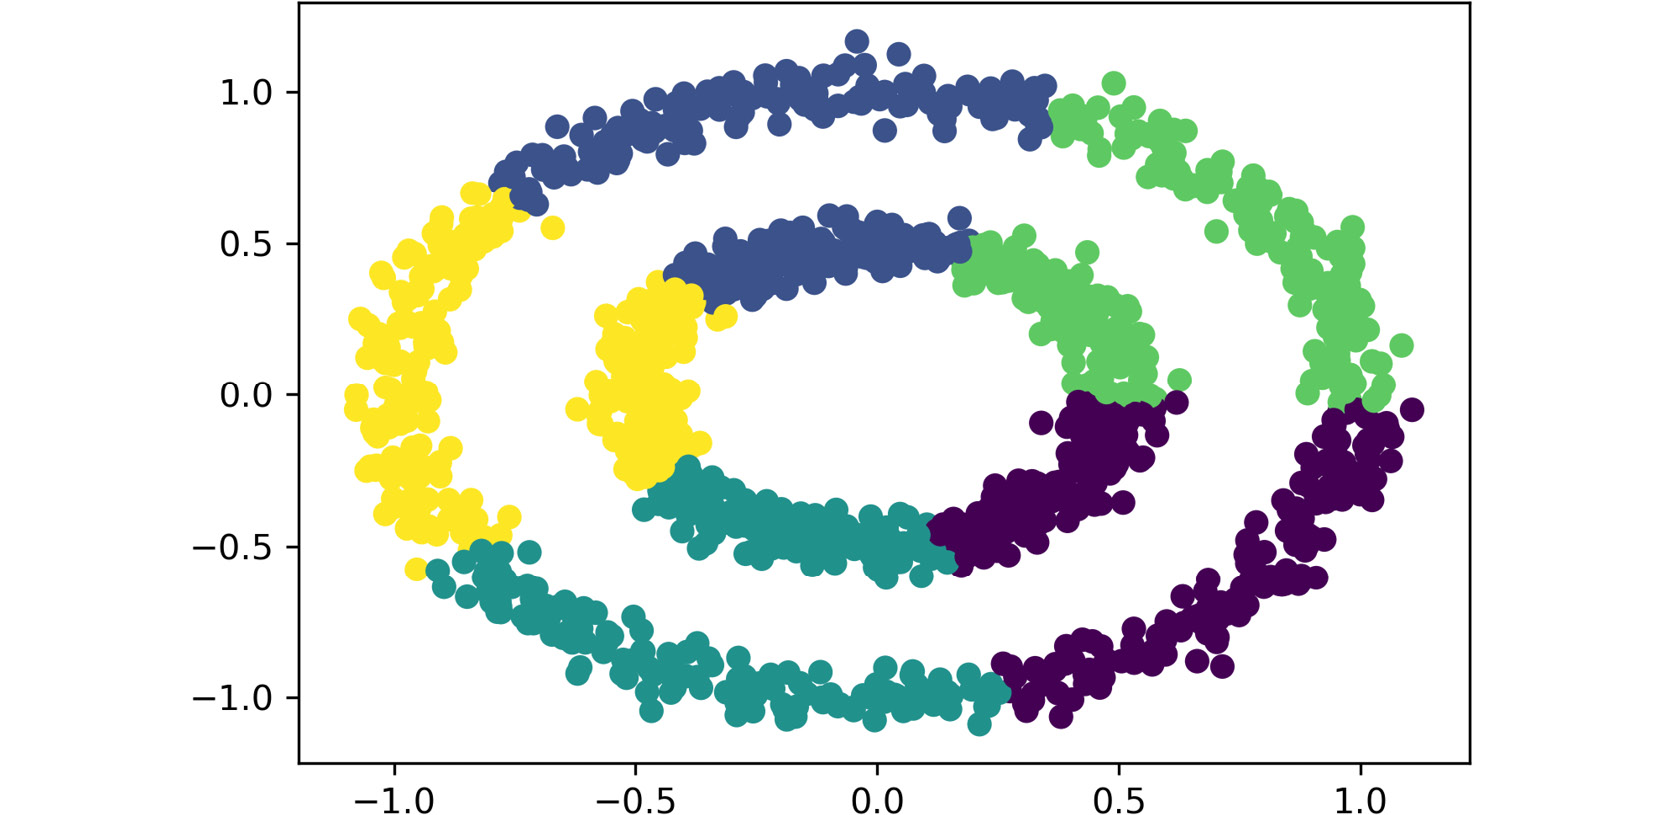
- Plot the results from the clustering of data points into clusters:
plt.scatter(data.iloc[:,0], data.iloc[:,1], c=pred_kmeans)
plt.show()
The output is as follows:
Figure 2.8: A screenshot showing the output of the plot function used
Since the dataset only contains two features, each feature is passed as input to the scatter plot function, meaning that each feature is represented by an axis. Additionally, the labels that were obtained from the clustering process are used as the colors to display the data points. Thus, each data point is located in the data space based on the values of both features, and the colors represent the clusters that were formed.
Note
For datasets with over two features, the visual representation of clusters is not as explicit as that shown in the preceding screenshot. This is mainly because the location of each data point (observation) in the data space is based on the collection of all of its features, and visually, it is only possible to display up to three features.
You have successfully imported and trained the k-means algorithm.
Note
To access the source code for this exercise, please refer to https://packt.live/30GXWE1.
You can also run this example online at https://packt.live/2B6N1c3. You must execute the entire Notebook in order to get the desired result.
In conclusion, the k-means algorithm seeks to divide the data into K number of clusters, K being a parameter set by the user. Data points are grouped together based on their proximity to the centroid of a cluster, which is calculated by an iterative process.
The initial centroids are set according to the initialization method that's been defined. Then, all the data points are assigned to the clusters with the centroid closer to their location in the data space, using the Euclidean distance as a measure. Once the data points have been divided into clusters, the centroid of each cluster is recalculated as the mean of all data points. This process is repeated several times until a stopping criterion is met.
Activity 2.02: Applying the k-means Algorithm to a Dataset
Ensure that you have completed Activity 2.01, Using Data Visualization to Aid the Pre-processing Process, before you proceed with this activity.
Continuing with the analysis of your company's past orders, you are now in charge of applying the k-means algorithm to the dataset. Using the previously loaded Wholesale Customers dataset, apply the k-means algorithm to the data and classify the data into clusters. Perform the following steps to complete this activity:
- Open the Jupyter Notebook that you used for the previous activity. There, you should have imported all the required libraries and performed the necessary steps to pre-process the dataset.
- Calculate the average distance of the data points from their cluster centroid in relation to the number of clusters. Based on this distance, select the appropriate number of clusters to train the model.
- Train the model and assign a cluster to each data point in your dataset. Plot the results.
Note
You can use the subplots() function from Matplotlib to plot two scatter graphs at a time. To learn more about this function, visit Matplotlib's documentation at the following link: https://matplotlib.org/api/_as_gen/matplotlib.pyplot.subplots.html.
The solution for this activity can be found via this link.
The visualization of clusters will differ based on the number of clusters (k) and the features to be plotted.


 Free Chapter