Stacked bar charts are of course possible by using a special parameter from the pyplot.bar() function.
The following script stacks two bar charts on each other:
import matplotlib.pyplot as plt

A = [5., 30., 45., 22.]
B = [5., 25., 50., 20.]

X = range(4)

plt.bar(X, A, color = 'b')
plt.bar(X, B, color = 'r', bottom = A)
plt.show()
The preceding script will produce the following graph:

The optional bottom parameter of the pyplot.bar() function allows you to specify a starting value for a bar. Instead of running from zero to a value, it will go from the bottom to value. The first call to pyplot.bar() plots the blue bars. The second call to pyplot.bar() plots the red bars, with the bottom of the red bars being at the top of the blue bars.
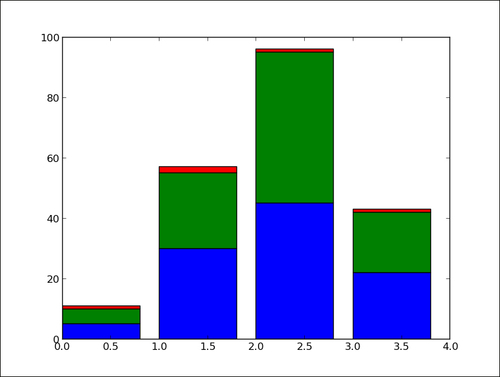
When stacking more than two set of values, the code gets less pretty as follows:
import numpy as np
import matplotlib.pyplot as plt

A = np.array([5., 30., 45., 22.])
B = np.array([5., 25., 50., 20.])
C = np.array([1.,  2.,  1.,  1.])
X = np.arange(4)

plt.bar(X, A, color = 'b')
plt.bar(X, B, color = 'g', bottom = A)
plt.bar(X, C, color = 'r', bottom = A + B)

plt.show()
For the third bar chart, we have to compute the bottom values as A + B, the coefficient-wise sum of A and B. Using NumPy helps to keep the code compact but readable. This code is, however, fairly repetitive and works for only three stacked bar charts. We can do better using the following code:
import numpy as np
import matplotlib.pyplot as plt

data = np.array([[5., 30., 45., 22.],
  [5., 25., 50., 20.],
  [1.,  2.,  1.,  1.]]

color_list = ['b', 'g', 'r']

X = np.arange(data.shape[1])
for i in range(data.shape[0]):
  plt.bar(X, data[i],
    bottom = np.sum(data[:i], axis = 0),
    color = color_list[i % len(color_list)])

plt.show()
Here, we store the data in a NumPy array, one row for one bar chart. We iterate over each row of data. For the ith row, the bottom parameter receives the sum of all the rows before the ith row. Writing the script this way, we can stack as many bar charts as we wish with minimal effort when changing the input data.