Book Image

IBM Cognos Business Intelligence

Book Image

IBM Cognos Business Intelligence

Overview of this book

IBM Cognos is Business Intelligence software that enables businesses to fully utilize their maximum potential. It connects people with information from virtually any data source whenever and wherever they need it so that they can make better decisions, faster.Take the practical, hands-on approach to managing your reporting environment with "IBM Cognos Business Intelligence" - packed with coverage of all the latest features to truly help you maximize your potential.With this in-depth practical guide you will learn how to fully utilize IBM Cognos 10 so that your business can make smarter decisions, achieve better results and gain a deeper understanding of your company's data. You will learn about critical topics like Report Studio, Query Studio, Analysis Studio, Security and Administration as well as in-depth coverage of other features like Business Insight, Business Insight Advanced, and Active Reports, which were introduced with IBM Cognos 10.
Table of Contents (21 chapters)
IBM Cognos Business Intelligence
Credits
Foreword
About the Author
Acknowledgement
About the Reviewers
www.PacktPub.com
Preface
Index

Exploring the drag-and-drop interface and the right-click menu


Let's now look at actually creating an analysis by using the drag-and-drop functionality and the right-click menu. Just like we saw with Query Studio, the goal of creating Cognos Analysis Studio was to make the user interface as simple as possible. Let's explore it!

Inserting dimensions and measures

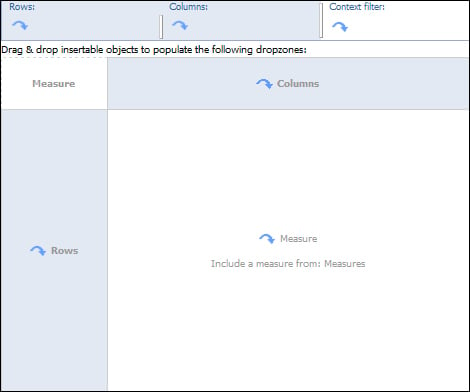
We will start by adding dimensions and measures to our analysis. If we look at the drop zones of the analysis, we can see that they clearly label where you should drag-and-drop each element with labels that say Rows, Columns, and Measure:

For the purpose of our example, we will drag in Years to Columns, Products to Rows, and Revenue to Measure.

Once complete, our analysis looks like the following screenshot:

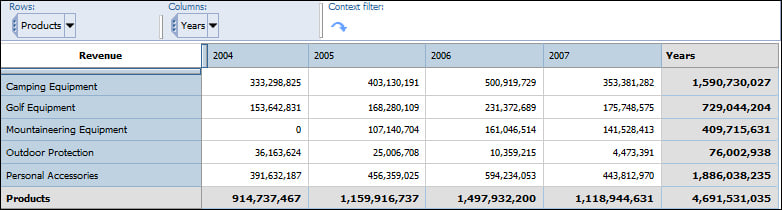
The real value of this analysis is that you are able to identify cross-points for two dimensions at once. For example, we can see revenue by both Products and Years at the same time, as seen in the preceding screenshot. We will now...