
QlikView is developed by QlikTech, a company that was founded in Sweden in 1993, but has since moved its headquarters to the US. QlikView is a tool used for Business Intelligence, often shortened to BI. Business Intelligence is defined by Gartner, a leading industry analyst firm, as:
An umbrella term that includes the application, infrastructure and tools, and best practices that enable access to and analysis of information to improve and optimize decisions and performance.
Following this definition, QlikView is a tool that enables access to information in order to analyze this information, which in turn improves and optimizes business decisions and performance.
Historically, BI has been very much IT-driven. IT departments were responsible for the entire Business Intelligence life cycle, from extracting the data to delivering the final reports, analyses, and dashboards. While this model works very well for delivering predefined static reports, most businesses find that it does not meet the needs of their business users. As IT tightly controls the data and tools, users often experience long lead-times whenever new questions arise that cannot be answered with the standard reports.
QlikTech prides itself in taking an approach to Business Intelligence that is different from what companies such as Oracle, SAP, and IBM—described by QlikTech as traditional BI vendors—are delivering. They aim to put the tools in the hands of business users, allowing them to become self-sufficient because they can perform their own analyses.
Independent industry analyst firms have noticed this different approach as well. In 2011, Gartner created a subcategory for Data Discovery tools in its yearly market evaluation, the Magic Quadrant Business Intelligence platform. QlikView was named the poster child for this new category of BI tools.
QlikTech chooses to describe itself as a Business Discovery enterprise instead of Data Discovery enterprise. It believes that discovering business insights is much more important than discovering data. The following diagram outlines this paradigm:
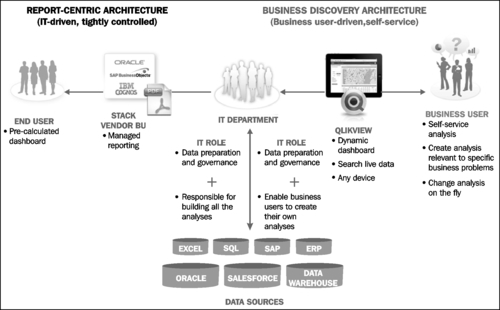
Besides the difference in who uses the tool—IT users versus business users—there are a few other key features that differentiate QlikView from other solutions.
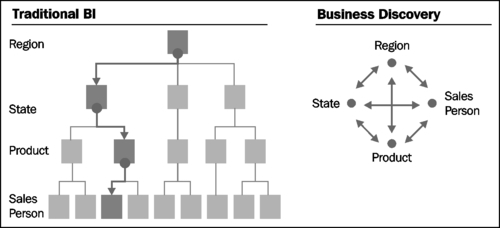
The main difference between QlikView and other BI solutions is the associative user experience. Where traditional BI solutions use predefined paths to navigate and explore data, QlikView allows users to take whatever route they want. This is a far more intuitive way to explore data. QlikTech describes this as "working the way your mind works."
An example is shown in the following image. While in a typical BI solution, we would need to start by selecting a Region and then drill down step-by-step through the defined drill path, in QlikView we can choose whatever entry point we like—Region, State, Product, or Sales Person. We are then shown only the data related to that selection, and in our next selection we can go wherever we want. It is infinitely flexible.
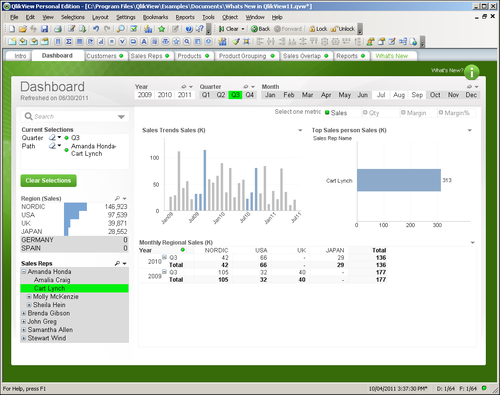
Additionally, the QlikView user interface allows us to see which data is associated with our selection.
For example, the following screenshot (from QlikTech's What's New in QlikView 11 demo document) shows a QlikView Dashboard in which two values are selected. In the Quarter field, Q3 is selected, and in the Sales Reps field, Cart Lynch is selected. We can see this because these values are green, which in QlikView means that they have been selected. When a selection is made, the interface automatically updates to not only show which data is associated with that selection, but also which data is not associated with the selection. Associated data has a white background, while non-associated data has a gray background. Sometimes the associations can be pretty obvious; it is no surprise that the third quarter is associated with the months July, August, and September. However, at other times, some not-so-obvious insights surface, such as the information that Cart Lynch has not sold any products in Germany or Spain. This extra information, not featured in traditional BI tools, can be of great value, as it offers a new starting point for investigation.
QlikView's core technological differentiator is that it uses an in-memory data model, which stores all of its data in RAM instead of using disk. As RAM is much faster than disk, this allows for very fast response times, resulting in a very smooth user-experience.
In a later part of this chapter, we will go a bit deeper into the technology behind QlikView.
There is also a difference between QlikView and traditional BI solutions in the way it is typically rolled out within a company. Where traditional BI suites are often implemented top-down—by IT selecting a BI tool for the entire company—QlikView often takes a bottom-up adoption path. Business users in a single department adopt it, and its use spreads out from there.
Note
QlikView is free of charge for single-user use. This is called the Personal Edition or PE. Documents created in Personal Edition can be opened by fully-licensed users or deployed on a QlikView server. The limitation is that, with the exception of some documents enabled for PE by QlikTech, you cannot open documents created elsewhere, or even your own documents if they have been opened and saved by another user or server instance.
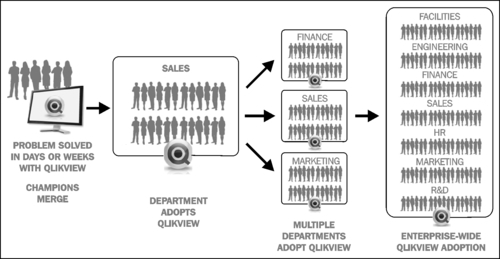
Often, a business user will decide to download QlikView to see if he can solve a business problem. When other users within the department see the software, they get enthusiastic about it, so they too download a copy. To be able to share documents, they decide to purchase a few licenses for the department. Then other departments start to take notice too, and QlikView gains traction within the organization. Before long, IT and senior management also take notice, eventually leading to enterprise-wide adoption of QlikView.
QlikView facilitates every step in this process, scaling from single laptop deployments to full enterprise-wide deployments with thousands of users. The following graphic demonstrates this growth within an organization:
As the popularity and track record of QlikView have grown, it has gotten more and more visibility at the enterprise level. While the adoption path described before is still probably the most common adoption path, it is not uncommon nowadays for a company to do a top-down, company-wide rollout of QlikView.