

Now that we know what QlikView is and how it is different from traditional BI offerings, we will learn how we can explore data within QlikView.
Of course, before we can start exploring, we need to install QlikView. You can download QlikView's Personal Edition from http://www.qlikview.com/download. You will be asked to register on the website, or log in if you have registered before.
Note
Registering not only gives you access to the QlikView software, but you can also use it to read and post on the QlikCommunity (http://community.qlikview.com) which is the QlikTech's user forum. This forum is very active and many questions can be answered by either a quick search or by posting a question.
Installing QlikView is very straightforward, simply double-click on the executable file and accept all default options offered. After you are done installing it, launch the QlikView application. QlikView will open with the start page set to the Getting Started tab, as seen in the following screenshot:
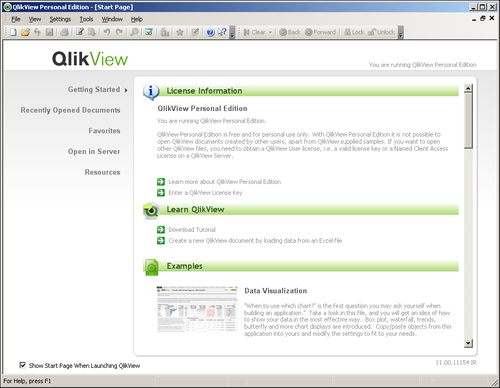
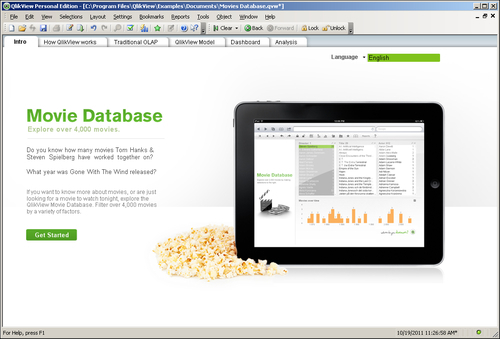
The example we will be using is the Movie Database, which is an example document that is supplied with QlikView. Find this document by scrolling down the Examples list (it is around halfway down the list) and click to open it. The opening screen of the document will now be displayed:
Most QlikView documents are organized into multiple sheets. These sheets often display different viewpoints on the same data, or display the same information aggregated to suit the needs of different types of users. An example of the first type of grouping might be a customer or marketing view of the data, an example of the second type of grouping might be a KPI dashboard for executives, with a more in-depth sheet for analysts.
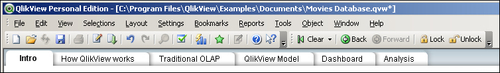
Navigating the different sheets in a QlikView document is typically done by using the tabs at the top of the sheet, as shown in the following screenshot. More sophisticated designs may opt to hide the tab row and use buttons to switch between the different sheets.
The tabs in the Movie Database document also follow a logical order. An introduction is shown on the Intro tab, followed by a demonstration of the key concept of QlikView on the How QlikView works tab. After the contrast with Traditional OLAP is shown, the associative QlikView Model is introduced. The last two tabs show how this can be leveraged by showing a concrete Dashboard and Analysis:
As we saw when we learned about the associative user experience, any selections made in QlikView are automatically applied to the entire data model. As we will see in the next section, slicing and dicing your data really is as easy as clicking and viewing!
But where should we click? QlikView lets us select data in a number of ways. A common method is to select a value from a list-box. This is done by clicking in the list-box.
Let's switch to the How QlikView works tab to see how this works. We can do this by either clicking on the How QlikView works tab on the top of the sheet, or by clicking on the Get Started button.
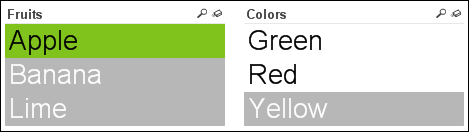
The selected tab shows two list boxes, one containing Fruits and the other containing Colors. When we select Apple in the Fruits list-box, the screen automatically updates to show the associated data in the Colors list-box: Green and Red. The color Yellow is shown with a gray background to indicate that it is not associated, as seen below, since there are no yellow apples. To select multiple values, all we need to do is hold down Ctrl while we are making our selection.
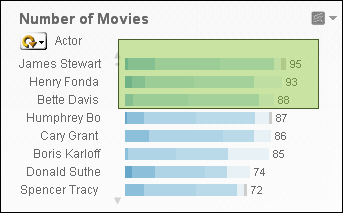
Besides selections in list-boxes, we can also directly select data in charts. Let's jump to the Dashboard tab and see how this is done. The Dashboard tab contains a chart labeled Number of Movies, which lists the number of movies by a particular actor. If we wish to select only the top three actors, we can simply drag the pointer to select them in the chart, instead of selecting them from a list-box:
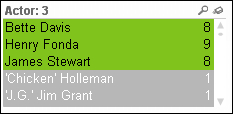
Because the selection automatically cascades to the rest of the model, this also results in the Actor list-box being updated to reflect the new selection:
Of course, if we want to select only a single value in a chart, we don't necessarily need to lasso it. Instead, we can just click on the data point to select it. For example, clicking on James Stewart leads to only that actor being selected.
While list-boxes and lassoing are both very convenient ways of selecting data, sometimes we may not want to scroll down a big list looking for a value that may or may not be there. This is where the search option comes in handy.
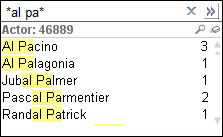
For example, we may want to run a search for the actor Al Pacino. To do this, we first activate the corresponding list-box by clicking on it. Next, we simply start typing and the list-box will automatically be updated to show all values that match the search string. When we've found the actor we're looking for, Al Pacino in this case, we can click on that value to select it:
Sometimes, we may want to select data based on associated values. For example, we may want to select all of the actors that starred in the movie Forrest Gump. While we could just use the Title list-box, there is also another option: associated search.
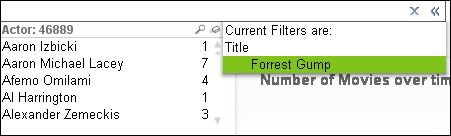
To use associated search, we click on the chevron on the right-hand side of the search box. This expands the search box and any search term we enter will not only be checked against the Actor list-box, but also against the contents of the entire data model. When we type in Forrest Gump, the search box will show that there is a movie with that title, as seen in the screenshot below. If we select that movie and click on Return, all actors which star in the movie will be selected.
Inevitably, when exploring data in QlikView, there comes a point where we want to save our current selections to be able to return to them later. This is facilitated by the bookmark option. Bookmarks are used to store a selection for later retrieval.
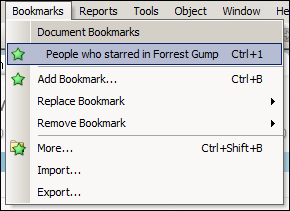
To create a new bookmark, we need to open the Add Bookmark dialog. This is done by either pressing Ctrl + B or by selecting Bookmark | Add Bookmark from the menu.
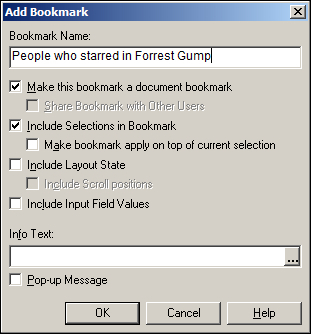
In the Add Bookmark dialog, seen in the screenshot below, we can add a descriptive name for the bookmark. Other options allow us to change how the selection is applied (as either a new selection or on top of the existing selection) and if the view should switch to the sheet that was open at the time of creating the bookmark. The Info Text allows for a longer description to be entered that can be shown in a pop-up when the bookmark is selected.
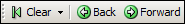
Fortunately, if we end up making a wrong selection, QlikView is very forgiving. Using the Clear, Back, and Forward buttons in the toolbar, we can easily clear the entire selection, go back to what we had in our previous selections, or go forward again. Just like in our Internet browser, the Back button in QlikView can take us back multiple steps:
Besides filtering data, QlikView also lets us change the information being displayed. We'll see how this is done in the following sections.
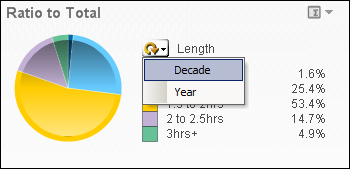
Cyclic Groups are defined by developers as a list of dimensions that can be switched between users. On the frontend, they are indicated with a circular arrow. For an example of how this works, let's look at the Ratio to Total chart, seen in the following image. By default, this chart shows movies grouped by duration. If we click on the little downward arrow next to the circular arrow, we will see a list of alternative groupings. Click on Decade to switch to the view to movies grouped by decade.
Drill down Groups are defined by the developer as a hierarchical list of dimensions which allows users to drill down to more detailed levels of the data. For example, a very common drill down path is Year | Quarter | Month | Day. On the frontend, drill down groups are indicated with an upward arrow.
In the Movies Database document, a drill down can be found on the tab labeled Traditional OLAP. Let's go there.
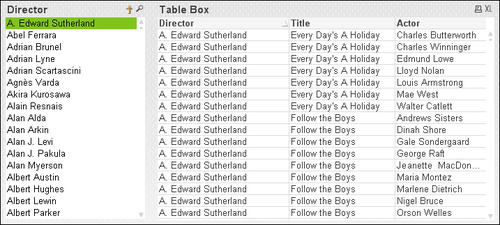
This drill down follows the path Director | Title | Actor. Click on the Director A. Edward Sutherland to drill down to all movies that he directed, shown in the following screenshot. Next, click on Every Day's A Holiday to see which actors starred in that movie. When drilling down, we can always go back to the previous level by clicking on the upward arrow, located at the top of the list-box in this example.
Containers are used to alternate between the display of different objects in the same screen space. We can select the individual objects by selecting the corresponding tab within the container. Our Movies Database example includes a container on the Analysis sheet.
The container contains two objects, a chart showing Average length of Movies over time and a table showing the Movie List, shown in the following screenshot. The chart is shown by default, you can switch to the Movie List by clicking on the corresponding tab at the top of the object.
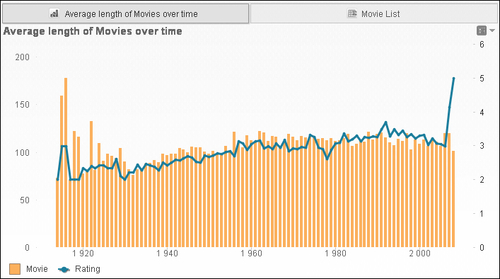
On the time chart, we can switch between Average length of Movies and Movie List by using the tabs at the top of the container object.
After all of the slicing, dicing, drilling, and view-switching we've done, there is still the question on our minds: how can we export our selected data to Excel? Fortunately, QlikView is very flexible when it comes to this, we can simply right-click on any object and choose Send to Excel, or, if it has been enabled by the developer, we can click on the XL icon in an object's header.
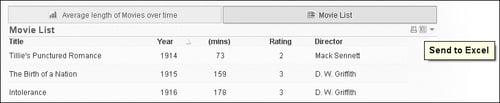
Click on the XL icon in the Movie List table to export the list of currently selected movies to Excel.
Tip
A word of warning when exporting data
When viewing tables with a large number of rows, QlikView is very good at only rendering those rows that are presently visible on the screen. When Export values to Excel is selected, all values must be pulled down into an Excel file. For large data sets, this can take a considerable amount of time and may cause QlikView to become unresponsive while it provides the data.