Book Image

QlikView 11 for Developers

Book Image

QlikView 11 for Developers

Overview of this book

Business Intelligence technologies are a must-have in every business to make informed decisions and keep up-to speed with the ever-evolving markets. QlikView's disruptive technology makes it a key player and leader in the industry; with its flexibility and powerful analytics environment, building QlikView apps can be mastered by both, business users as well as developers. This book will help you learn QlikView Development from a basic to a practitioner level using a step-by-step approach in a practical environment, and apply proven best practices on each topic. Throughout the book, we will build a QlikView app based on real data about Airline Operations that will help "HighCloud Airlines" make informed business decisions and analysis-guided strategies. HighCloud Airlines executives are evaluating if entering the US market is a good strategy and, if so, which line of business should they focus their investments on; they need QlikView to make the best decision. The application will be evolving chapter by chapter, along with your skills, going from a simple proof of concept to creating a Data Model, adding a custom style, building a Dashboard and handling and manipulating the source data via script. We will meet the "HighCloud Airlines" requirement by using many different data visualization objects and time-saving techniques. The whole application uses real data taken from the Bureau of Transportations statistics of the US and encompasses the operations of Airlines both domestic and international. With three years worth of data, you will help HighCloud Airlines discover where people travel the most, which are the Carriers with the most market share, what is the average load factor per airline, which aircraft is the most used to perform flights, which are the busiest airports, and a whole universe of new insights.
Table of Contents (23 chapters)
QlikView 11 for Developers
Credits
Foreword
About the Authors
Acknowledgements
About the Reviewers
www.PacktPub.com
Preface
Index

The Table Viewer window


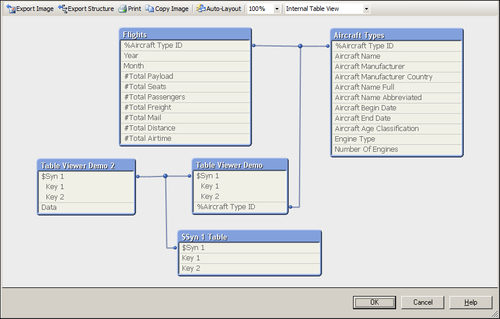
We already had a small peek at the Table Viewer window in previous chapters. As this feature is very useful when analyzing our data models, let's take a more in-depth look. To illustrate, consider the data model seen in the following Table Viewer window:

The Table Viewer window can be opened by selecting File | Table Viewer from the menu bar, or by pressing Ctrl + T.

The table viewer shows the tables (boxes) and their associations (connectors). When more than two tables are associated via the same key, it will be indicated with a small blue dot in the connector line.

The layout of the tables and connection points can be changed by clicking and dragging the header and connection point, respectively. Tables can also be resized when hovering over and dragging their edges. Of course, it is not mandatory to create a clean layout for your data model, but it is recommended as it makes a diagram easier to understand.

A lot of information about our data model can be learned from...