

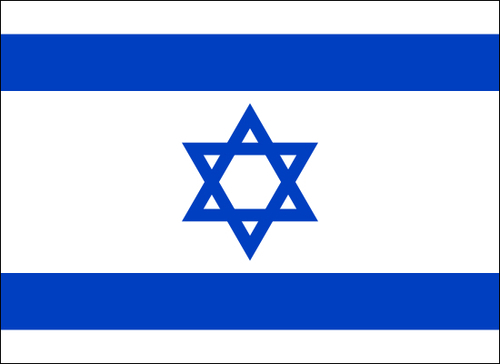
It's time to take everything we learned and integrate it into the most complex shape we have seen so far, the Star of David. This star is part of the flag of Israel (one of my favorite flags in the world ;)). We need to take a roundabout before we can create it by visiting the magical world of sine and cosine.
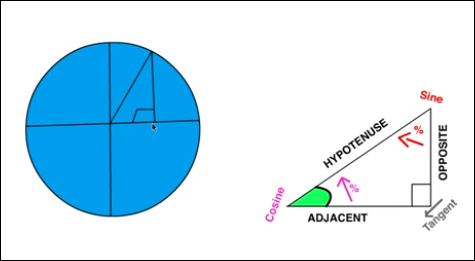
You got to love it, right? I know many people fear cosines and sines but actually they are really easy and fun to work with. Let's break them down here in a more programming-for-drawing type of way. The most basic idea is that you have a triangle that has a 90 degree angle. You have some information about this triangle, and that's all you need to be able to start working with sine and cosine. Once you know that you have a 90 degree angle and know the sine/cosine, you have all the information you need and with it you can discover any missing information. In our case we know all the angles and we know the length of the hypotenuse (it's our radius; take a look at the image with the circle to see it in action). In JavaScript, the methods Math.cos() and Math.sin() are both representing a circle with a radius of one located on the (0,0) point on the screen. If we input the angle we are looking for into the sin function, it would return the x value (in this case the length of the adjacent) and the cos function would return the length of the opposite, in our case the required value y.
I've made a nice video which goes deeper into the logic. You can check it out at http://02geek.com/courses/video/58/467/Using-Cos-and-Sin-to-animate.html.
The easiest way to understand how sine/cosine work is by a live example, and in our case we will use it to help us figure out how to create the Star of David in the flag of Israel. We will take a step back and learn how we figured out the points on the screen to create the shapes. Again we will be skipping the creation of the HTML file and will go right into the JavaScript code. For an overview of how to get your HTML set, please review the Graphics with 2D canvas recipe.
After creating the JavaScript file add the following code in your init function.
Create our basic canvas variables:
var canvas = document.getElementById("israel");
var wid = canvas.width;
var hei = canvas.height;
var context = canvas.getContext("2d");
Define one degree in radians. We do that since
Math.cosandMath.sinexpect a radian value and not a degree value (radianis one degree measured in radians):var radian = Math.PI/180;
Create a
tiltvariable. This variable will define the tilt of the triangle that will be created. Imagine the triangle is in a circle and we are rotating the circle with thistiltvariable:var tilt = radian*180;
Define the center point of the canvas:
var baseX = wid / 2;
var baseY = hei / 2;
Set the radius of the invisible bounding circle of the Star of David:
var radius = 24;
Define the height of the strips in the flag:
var stripHeight = 14;
Define a line width:
context.lineWidth=5;
Create two triangles (one tilted and one not):
createTrinagle(context,
  baseX+ Math.sin(0) * radius, baseY + Math.cos(0) * radius,
  baseX+ Math.sin(radian*120) * radius, baseY + Math.cos(radian*120) * radius,
  baseX+ Math.sin(radian*240) * radius, baseY + Math.cos(radian*240) * radius,
  null,"#0040C0");

createTrinagle(context,
  baseX+ Math.sin(tilt) * radius, baseY + Math.cos(tilt) * radius,
  baseX+ Math.sin(radian*120+tilt) * radius, baseY + Math.cos(radian*120+tilt) * radius,
  baseX+ Math.sin(radian*240+tilt) * radius, baseY + Math.cos(radian*240+tilt) * radius,
  null,"#0040C0");
context.lineWidth=stripHeight;
context.beginPath();
context.moveTo(0,stripHeight);
context.lineTo(wid,stripHeight);
context.moveTo(0,hei- stripHeight);
context.lineTo(wid,hei- stripHeight);
context.closePath();
context.stroke();
Create the
createTrianglefunction:function createTriangle(context,x1,y1,x2,y2,x3,y3,fillColor,strokeColor){ context.beginPath(); context.moveTo(x1,y1); context.lineTo(x2,y2); context.lineTo(x3,y3); context.lineTo(x1,y1); context.closePath(); if(fillColor) { context.fillStyle = fillColor; context.fill(); } if(strokeColor){ context.strokeStyle = strokeColor; context.stroke(); } }
You are done. Run your application and you will find the flag of Israel with the Star of David in the center of the flag.
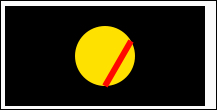
Before we dig into the creation of the flag and how it was done, we need to understand how we locate points in a circle. To do so let's look at a simpler example:
var rad = Math.PI/180;
context.fillStyle = "#FFDE00";
context.arc(wid / 2, hei / 2, 30, 0, 2 * Math.PI, false);
context.fill();
context.beginPath();
context.strokeStyle = "#ff0000";
context.lineWidth=6;
context.moveTo(Math.sin(0) * 30 + wid / 2, Math.cos(0) * 30 + hei/2);
context.lineTo(Math.sin(rad*120) * 30 + wid / 2, Math.cos(rad*120) * 30 + hei/2);
context.stroke();
The following is the output the code will generate:
Although a circle, in our human-friendly head, is a shape that has 360 degrees, it's actually best represented in most programming languages in radians.
Radians are just like degrees, only instead of being human-friendly numbers between 0 and 360 these are numbers between 0 and two times Pi. You might be wondering what Pi is, so a bit more on Pi. Pi is in essence the value that is created when you take the circumference of any circle and divide it by the diameter of the same circle. The result that would come back would be Pi or about 3.14159. It is a magical number and the good news is you don't need to know much more about it if you don't want to. All you need to know is that 3.142 is equal to half of a circle. With that fact we can now divide Pi by 180 to get a value in radian that equals one degree:
var rad = Math.PI/180;
We then create a circle with a radius of 30 in the center of the screen, to help us visualize this, and move on to start creating a line that will start at angle 0 of our circle and end at angle 120 (as we want to create a triangle 360/3).
context.strokeStyle = "#ff0000";
context.lineWidth=6;
context.moveTo(Math.sin(0) * 30 + wid / 2, Math.cos(0) * 30 + hei/2);
context.lineTo(Math.sin(rad*120) * 30 + wid / 2, Math.cos(rad*120) * 30 + hei/2);
context.stroke();
Let's break down the most complex line:
context.lineTo(Math.sin(rad*120) * 30 + wid / 2, Math.cos(rad*120) * 30 + hei/2);
As Math.sin and Math.cos return a value for a radius of 1, we will multiply any value returned by the radius of our circle (in this case 30). In the parameters of Math.sin and Math.cos, we will provide the exact same values; in this example 120 radians. As our circle would be centered at the top left-hand side of the canvas we want to shift the circle to start from the center of the screen by adding to our values wid/2 and hei/2.
At this stage, you should know how to find points on a circle, and with that how to draw lines between two points. Let's go back to our flag of Israel and take a deeper look into the new function createTriangle. It was based on the function fillTriangle created in the Creating shapes using paths recipe.
function createTriangle(context,x1,y1,x2,y2,x3,y3,fillColor,strokeColor){

...

  if(fillColor) {
    context.fillStyle = fillColor;
    context.fill();
  }

if(stokeColor){
    context.strokeStyle = fillColor;
    context.stroke();

  }

}
I've highlighted the new components of this function compared to the function fillTriangle. The two new parameters fillColor and strokeColor define if we should fill or stroke the triangle. Notice that we moved the strokeStyle and fillStyle methods to the bottom of our function to reduce our code footprint. Great! We now have a modern triangle creator that could deal with the Star of David.
OK, time to connect the dots (literally speaking) and create the flag of Israel. Looking back at our original code we find ourselves using the createTriangle function twice to create the full Star of David shape. Let's take a deeper look at the logic here by looking at the second triangle (the one that is turned upside down):
createTriangle(context,
  baseX+ Math.sin(tilt) * radius,
  baseY + Math.cos(tilt) * radius,
  baseX+ Math.sin(radian*120+tilt) * radius,
  baseY + Math.cos(radian*120+tilt) * radius,
baseX+ Math.sin(radian*240+tilt) * radius,
  baseY + Math.cos(radian*240+tilt) * radius, null,"#0040C0");
We are sending in three points on the virtual circle to create a triangle. We split our virtual circle to three equal parts and find the point values at the 0, 120, and 240 degrees. This way if we drew a line between these points we would get a perfect triangle in which all of the sides were equal.
Let's take a deeper look at one of the points sent to the createTriangle function:
baseX + Math.sin(radian*120+tilt) * radius,
baseY + Math.cos(radian*120+tilt) * radius
We start from baseX and baseY (the center of the screen) as the center point of our circle before we figure out the actual point gap from that base starting point. We then add to it the value that we get from Math.sin and Math.cos respectively. In this example, we are trying to get 120 degrees plus the tilt value. In other words, 120 degrees plus 180 degrees (or 300 degrees).
To make it easier to comprehend, in pseudocode it would look similar to the following code snippet:
 startingPositionX + Math.sin(wantedDegree) * Radius
 startingPositionY + Math.cin(wantedDegree) * Radius
Not much more to say besides congrats. We just finished creating another flag and in the process, learned how to create complex shapes, use math to help us figure out points on the screen, and mix together different shapes to create more advanced shapes.