

No matter how experienced you are at scripting and making games, mistakes will always be made. Sometimes it may be a typo or a missing variable, and in this case GameMaker: Studio will catch this and display a code error dialog. Other times, the game may not do what you are expecting it to do, such as passing through a wall when you should not. In this case, there is nothing technically wrong with the code, it is just constructed improperly. Tracking down these bugs can be very tedious and possibly impossible if it were not for debugging tools. In order to use these tools, the game must be run in the debug mode, which you can access by clicking on the Run Debug Mode button in the toolbar, or by going into the Menu and navigating to Run | Run Debug Mode.
During the debug Mode, we can utilize Debug Messages
to help us understand what is occurring in the game. These messages can only be implemented through the show_debug_message() function when scripting (there is no drag-and-drop option) and will appear in a Console window whenever the function is executed. You can use this to pass a string or display a variable, so you can compare the result with what you expect the result should be. This is your first line of defense when trying to solve a problem.
The first console we should use is GameMaker: Studio's DEBUG console for HTML5. When the game is targeting HTML5 and run in the debug mode, a pop-up window will be created along with the game and contains the debug output where all the debug messages will appear, along with a list of the instance and their basic data information. Let's test this console out!
We will start by adding the traditional
Hello Worlddebug message on the creation of the player. Reopenscr_Player_Createand add the following code at the end of the script:myText = "Hello World"; show_debug_message(myText);
Tip
Downloading the example code
You can download the example code files for all Packt books you have purchased from your account at http://www.packtpub.com. If you purchased this book elsewhere, you can visit http://www.packtpub.com/support and register to have the files e-mailed directly to you.
We start by creating a variable to hold the string. While we can directly pass a string through the
show_debug_messagefunction without the variable, we will be using this variable in a later debug test.As this script is already attached to our Player's Create event, we can just go ahead and run the game. Click on the Run Debug Mode icon.
When the game starts in the browser, a second window will pop up with the DEBUG console as seen in the next screenshot. If you do not see this window, check to ensure the browser allows pop ups. Scroll down to the bottom of the Debug Output column. Here you should see the debug message
Hello World. This indicates that our code was successfully executed. If we didn't see it as expected, then we would have an idea of where the game is having issues.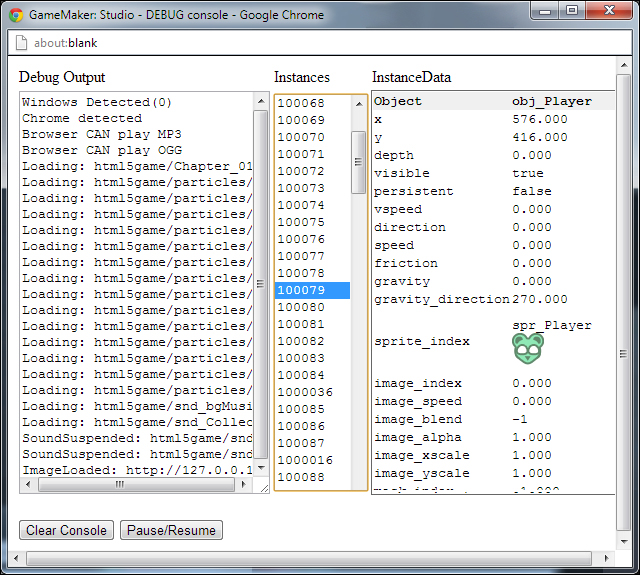
We can also see all the properties of each individual instance, represented by their instance number, in the game including the current position in the room, the sprite it is displaying and more. Click on any one of the numbers seen in the Instances column, and take a look at its properties in the InstanceData column.
Click on the Pause/Resume button. This allows us to pause the game, which is useful if you have lots of debug messages flooding the console, and you want to take time to see what is happening.
Finally, we can click on the Clear Console button to remove everything from the Debug Output column.
Congratulations! You can now start debugging your scripts. While you will be using show_debug_message a fair amount of time during a game's development, it is important to keep the amount of active messages to a minimum. It doesn't make sense to have so many debug messages occurring that you can't see what is happening!
While you can solve a large portion of your issues with debug messages, there are times when you will need more finite detail into what is happening in the game. GameMaker: Studio has a more advanced debugger that only runs if the game is being targeted for a Windows build. We would be remiss if we didn't at least have a cursory glance at this wonderful tool.
Change the Target to
Windowsand run the game in the debug mode. When the game opens up, the GameMaker Debugger will be displayed in a separate window, as shown in the following screenshot:
Some basic information is displayed immediately, such as how it is performing, by looking at Room Speed: (steps per second) and frames per second (FPS:). If you move your mouse cursor over the instances in your game, you will notice that the mouse id: will change. This ID is the unique identifier for that specific instance and will come in very handy.
The GameMaker Debugger window has many more options available for debugging the game. The Run menu not only allows us to pause the game, but we can also step forward one step at a time. The Watch menu allows you to track specific expressions, such as function calls or properties. The Tools menu gives access to debug messaging as we would expect, but can also display all the global variables, the per-instance variables, and a list of all the instances currently in existence. Let's take a look at what information the instance has in this Console.
Navigate to Tools | Show Instances. This will open a window that displays all the instances in the game.
Scroll down the list until you find
obj_Player. Double-click on it so we can see all of its properties. Much like the HTML5 DEBUG console, we can see where it is in the world and what Sprite it has (by Sprite index number). However, if you scroll down the list there are many more properties. In fact, if we look at the bottom of the list we can see themyTextvariable. That's awesome!
The last thing we will take a look at is the compiled JavaScript code. All modern browsers, such as Mozilla Firefox, Microsoft Internet Explorer 9.0, and Google Chrome come with built-in debug consoles that allow anyone to look at the source code of any website, and even affect what is being displayed on your local screen. That's right. Everyone can see the code for the game. While that might scare you, fear not! When GameMaker: Studio exports a game or it is run normally, it obfuscates the code making it very difficult to decipher. When run in the debug mode on the other hand, it does not do any obfuscation other than the engine itself.
Let's take a quick look at what this code looks like. We will start with the debug version so we can see what it would look like without obfuscation. For this example, we will use Chrome as it has the most robust debug console.
With the Target platform set to
HTML5, run the game in the debug mode.In the browser window in the area below the game, right-click and select Inspect Element. This will open Developer Tools for Chrome.
Select the Sources tab, and in the upper-left corner click on the little icon called Show Navigator.
In the Navigator there is a directory tree. Open the folders until you find the
html5folder. Inside this folder is the game. Click on the game and we should see all the code as can be seen in the next screenshot. If we scroll through the code we can clearly see the scripts we have created, properties of objects, and so on.
Let's now take a look at the obfuscated version. Close down the browser tab and then run the game in normal mode. Repeat the same process and take a look at the code. It should look like the next screenshot. We can still read some bits and pieces, but none of it makes any sense. You can feel fairly secure that few people will want to mess with this.
