

Working with the Visual Studio Solution
Every C++ project in Unreal Engine has a Visual Studio solution. This, in turn, drives all the code and provides developers with the ability to set up execution logic and debug code in its running state.
Solution Analysis
The Visual Studio solution (.sln) file that's produced inside the project directory contains the entire project and any associated code that's been added to it.
Let's have a look at the files present in Visual Studio. Double-click the .sln file to open it within Visual Studio.
In Solution Explorer, you will see two projects called Engine and Games.
The Engine Project
At the base level, Unreal Engine itself is a Visual Studio project and has its own solution file. This contains all the code and third-party integrations that work together in Unreal Engine. All the code within this project is called the "source" code.
The Engine project consists of the external dependencies, configurations, plugins, shaders, and source code of Unreal Engine that are currently being used for this project. You can, at any time, browse the UE4 -> Source folder to view any of the engine code.
Note
As Unreal Engine is open source, Epic allows developers to both view and edit source code to suit their needs and requirements. However, you cannot edit the source code in the version of Unreal Engine that's installed via the Epic Games Launcher. To be able to make and build changes in source code, you need to download the source version of Unreal Engine, which can be found via GitHub. You can use the following guide to download the Source Version of the Unreal Engine: https://docs.unrealengine.com/en-US/GettingStarted/DownloadingUnrealEngine/index.html
After downloading, you can also refer to the following guide for compiling/building the newly downloaded engine: https://docs.unrealengine.com/en-US/Programming/Development/BuildingUnrealEngine/index.html
Game Project
Under the Games directory is the solution folder with the name of your project. Upon expansion, you'll find a set of folders. You will be concerned with the following:
- Config Folder: Carries all the configurations that have been set up for the project and the build (these can optionally have platform-specific (such as Windows, Android, iOS, Xbox, or PS) settings as well).
- Plugins Folder: This is an optional folder that's created when you add any third-party plugin (downloaded from the Epic Marketplace or obtained through the internet). This folder will contain all of the source code of the plugins associated with this project.
- Source Folder: This is the primary folder we're going to be working with. It will contain the Build Target files, as well as all the source code for the project. The following is a description of the default files in the source folder:
- Target and Build Files: These (as shown in the following screenshot) contain code that specifies the Unreal Build Tool (the program that builds your game) that you will use to build your game. It contains any extra modules that need to be added to the game, as well as other build-related settings. By default, there are two target files (one for Unreal Editor and another for the build as depicted by their names), which end with the
.Target.csextension, and one build file that ends withBuild.cs. - ProjectName code files (.cpp & .h): By default, these files are created for each project and contain the code that's used to run the default game module code.
- ProjectNameGameModeBase code files (.cpp & .h): By default, an empty Project Game Mode Base is created. It's not usually used in most cases.
- ProjectName.uproject file: Contains the descriptors used to provide basic information about the project and the list of plugins associated with it.
Debugging Code in Visual Studio
Visual Studio provides powerful debugging features with the help of breakpoints in code. It enables users to pause the game at a particular line of code so that the developer can see the current values of variables and step through the code and game in a controlled fashion (can proceed line by line, function by function, or so on).
This is useful when you have a lot of variables and code files in your game project, and you want to see the values of the variables being updated and used in a step-by-step fashion to debug the code, find out what issues there are, and solve them. Debugging is a fundamental process of any developer's work, and only after many continuous debugging, profiling, and optimization cycles does a project get polished enough for deployment.
Now that you've got the basic idea of the Visual Studio solution, we'll move on and cover a practical exercise on it.
Exercise 2.02: Debugging the Third Person Template Code
In this exercise, you'll be creating a project using the Third Person Template of Unreal Engine and will debug the code from within Visual Studio. We'll be investigating the value of a variable called BaseTurnRate in the Character class of this template project. We'll see how the value updates as we move through the code, line by line.
The following steps will help you complete this exercise:
- Launch Unreal Engine from the Epic Games Launcher.
- Click on the
Gamessection and clickNext. - Select
Third Personand clickNext. - Select C++, set the project name to
ThirdPersonDebug, and click theCreate Projectbutton. - Now, close Unreal Editor, go to the Visual Studio solution, and open the
ThirdPersonDebugCharacter.cppfile: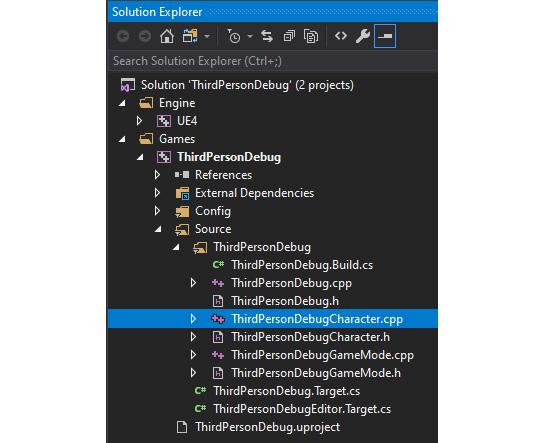
Figure 2.2: ThirdPersonDebugCharacter.cpp file location
- Left-click on the bar on the left-hand side of line
18. A red dot icon should appear on it (you can toggle it off by clicking on it again):
Figure 2.3: Collision capsule init code
Here, we are getting the
capsulecomponent (explained further in Chapter 3, Character Class Components and Blueprint Setup) of the character, which, by default, is the root component. Then, we are calling itsInitCapsuleSizemethod, which takes in two parameters: theInRadiusfloat andInHalfHeightfloat, respectively. - Make sure the solution configuration setting in VS is set to
Development Editorand click on theLocal Windows Debuggerbutton:
Figure 2.4: Visual Studio build settings
- Wait until you're able to see the following window in the bottom-left corner:
Note
If the window doesn't pop-up, you can open the window manually by opening
AutosunderDebug>Windows>Autos. Additionally, you may also uselocals.
Figure 2.5: Visual Studio variable watch window
thisshows the object itself. The object contains variables and methods that it stores, and by expanding it, we're able to see the state of the entire object and its variables at the current line of code execution. - Expand
this, thenACharacter, and thenCapsuleComponent. Here, you can see the values for theCapsuleHalfHeight = 88.0andCapsuleRadius = 34.0variables. Next to line18, where the red dot initially was, you will see an arrow. This means that the code is at the end of line17and has not executed line18yet. - Click the
Step Intobutton to go to the next line of code (Shortcut: F11).Step Intowill move into code inside the function (if present) on the line. On the other hand,Step Overwill just execute the current code and move to the next line. Since there is no function on the current line,Step Intowill mimic theStep Overfunctionality.
Figure 2.6: Debug step into
- Notice that the arrow has moved to line
21and that the variables have been updated.CapsuleHalfHeight = 96.0andCapsuleRadius = 42.0are highlighted in red. Also, notice that theBaseTurnRatevariable is initialized to0.0:
Figure 2.7: BaseTurnRate initial value
- Step in (F11) once again to go to line
22. Now, theBaseTurnRatevariable has a value of45.0andBaseLookUpRateis initialized to0.0, as shown in the following screenshot:
Figure 2.8: BaseTurnRate updated value
- Step in (F11) once again to go to line
27. Now, theBaseLookUpRatevariable has a value of45.0.
Similarly, you are encouraged to step in and debug other sections of the code to not only familiarize yourself with the debugger but also to understand how the code works behind the scenes.
By completing this exercise, you've learned how to set up debug points in Visual Studio, as well as stop debugging at a point, and then continue line by line while watching an object and its variable's values. This is an important aspect for any developer, and many often use this tool to get rid of pesky bugs within code, especially when there's a lot of code flows and the number of variables is quite large.
Note
At any point, you can stop debugging, restart debugging, or continue with the rest of the code by using the following buttons on the top menu bar:

Figure 2.9: Debugging tools in Visual Studio
Now, we'll look at importing assets into an Unreal project.