
Integrating EasyProfiler
Profiling enables developers to get vital measurement data and feedback in order to optimize the performance of their applications. EasyProfiler is a lightweight cross-platform profiler library for C++, which can be used to profile multithreaded graphical applications (https://github.com/yse/easy_profiler).
Getting ready
Our example is based on EasyProfiler version 2.1. The JSON snippet for Bootstrap to download it looks like this:
{
  "name": "easy_profiler",
  "source": {
    "type": "archive",
    "url": "https://github.com/yse/easy_profiler/            releases/download/v2.1.0/            easy_profiler-v2.1.0-msvc15-win64.zip",
    "sha1": "d7b99c2b0e18e4c6f963724c0ff3a852a34b1b07"
  }
}
There are two CMake options to set up in CMakeLists.txt so that we can build EasyProfiler without the GUI and demo samples:
set(EASY_PROFILER_NO_GUI ON CACHE BOOL "")
set(EASY_PROFILER_NO_SAMPLES ON CACHE BOOL "")
Now we are good to go and can use it in our application. The full source code for this recipe can be found in Chapter2/05_EasyProfiler.
How to do it...
Let's build a small application that integrates EasyProfiler and outputs a profiling report. Perform the following steps:
- First, let's initialize EasyProfiler at the beginning of our
main()function:#include <easy/profiler.h> ... int main() { EASY_MAIN_THREAD; EASY_PROFILER_ENABLE; ... - Now we can manually mark up blocks of code to be reported by the profiler:
  EASY_BLOCK("Create resources");
  const GLuint shaderVertex =    glCreateShader(GL_VERTEX_SHADER);
  ...
  const GLuint shaderFragment =    glCreateShader(GL_FRAGMENT_SHADER);
  ...
  GLuint perFrameDataBuffer;
  glCreateBuffers(1, &perFrameDataBuffer);
  ...
  EASY_END_BLOCK;
Blocks can be automatically scoped. So, once we exit a C++ scope via
}, the block will be automatically ended even if there is no explicit call toEASY_END_BLOCK, as shown in the following snippet:{ EASY_BLOCK("Set state"); glClearColor(1.0f, 1.0f, 1.0f, 1.0f); glEnable(GL_DEPTH_TEST); glEnable(GL_POLYGON_OFFSET_LINE); glPolygonOffset(-1.0f, -1.0f); } - Let's create some nested blocks inside the main loop. We use
std::this_thread::sleep_for( std::chrono::milliseconds(2) )to simulate some heavy computations inside blocks:while ( !glfwWindowShouldClose(window) ) { EASY_BLOCK("MainLoop"); ... { EASY_BLOCK("Pass1"); std::this_thread::sleep_for( std::chrono::milliseconds(2) ); ... } { EASY_BLOCK("Pass2"); std::this_thread::sleep_for( std::chrono::milliseconds(2) ); ... } { EASY_BLOCK("glfwSwapBuffers()"); glfwSwapBuffers(window); } { EASY_BLOCK("glfwPollEvents()"); std::this_thread::sleep_for( std::chrono::milliseconds(2) ); glfwPollEvents(); } } - At the end of the main loop, we save the profiling data to a file like this:
profiler::dumpBlocksToFile( "profiler_dump.prof" );
Now we can use the GUI tool to inspect the results.
How it works...
On Windows, we use the precompiled version of profiler_gui.exe, which comes with EasyProfiler:
profiler_gui.exe profiler_dump.prof
The output should look similar to the following screenshot:
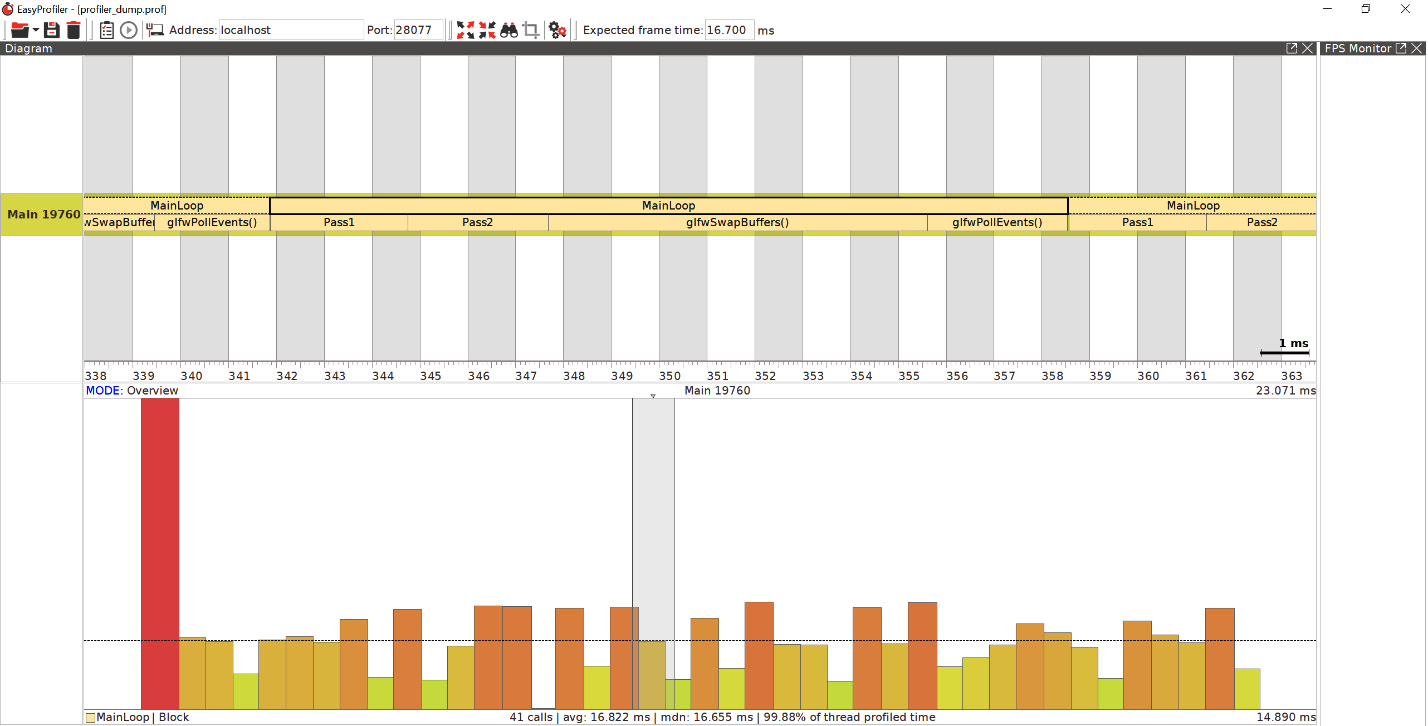
Figure 2.4 – The EasyProfiler GUI
There's more...
Blocks can have different colors, for example, EASY_BLOCK("Block1", profiler::colors::Magenta). Besides that, there is an EASY_FUNCTION() macro that will automatically create a block using the current function name as the block name. Custom ARGB colors can be used in the hexadecimal notation; for example, take a look at the following:
void bar() {
  EASY_FUNCTION(0xfff080aa);
}