

Let's try to plot a simple function that takes on infinite values within the domain of the plot:
pole_plot = plot(1 / (x - 1), (0.8, 1.2), detect_poles='show',
    marker='.')
print("min y = {0}   max y = {1}".format(pole_plot.ymax(),
    pole_plot.ymin()))
pole_plot.ymax(100.0)
pole_plot.ymin(-100.0)

# Use TeX to make nicer labels
pole_plot.axes_labels([r'$x$', r'$1/(x-1)$'])

pole_plot.show()
The output from this code is as follows:
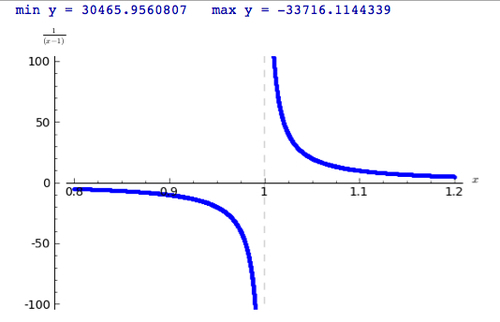
We did a few things differently compared to the previous example. We defined a callable symbolic expression right in the plot function. We also used the option detect_poles='show' to plot a dashed vertical line at the x value where the function returns infinite values. The option
marker='.' tells Sage to use a small dot to mark the individual (x,y) values on the graph. In this case, the dots are so close together that they look like a fat line. We also used the methods
ymin and
ymax to...